


Valuation Model - PRV Framework

Our HEAT map is the visual trade-off between Quality and Valuation: companies in the favorable (blue) area offer higher quality and/or cheaper valuation than those in the unfavorable (red) area.
The y-axis is our measure of Quality, where the higher the score, the higher the company’s quality or Risk-Adjusted Profitability is.
The x-axis is our measure of Valuation, which includes Wealth Ratios and Wealth Multiples (V1 and V2). This axis is plotted in reverse, so the most expensive stocks (highest V scores) are to the left and the cheapest V scores are plotted to the right.

HEAT Zones Defined
Our HEAT Map captures the key factors that constitute PRV: the trade-off between Quality and Valuation. Our Quality score is plotted on the y-axis, where the higher the value, the better the quality. Our Valuation factor is plotted on the x-axis, where the cheaper values are to the right and the expensive values are to the left. The green areas are in the ‘Favourable’ region:
Our ‘Best of Best’ have the largest disconnect between their Quality and Valuation: PRV > 70, Quality > 60, and Valuation < 40.
Our ‘Expensive But Worth It’ have the Quality of the Best of the Best but are more expensive: PRV > 70, Quality > 60, and Valuation > 60.
Our ‘Attractive Value’ are cheap like the Best of the Best but have much lower Quality: PRV > 70, Quality < 40, and Valuation < 40.
The zones highlighted by the red shapes are the opposite of the zones described above, all having similar Quality and Value scores but with PRV scores below 30. These generally underperform the universe over time.
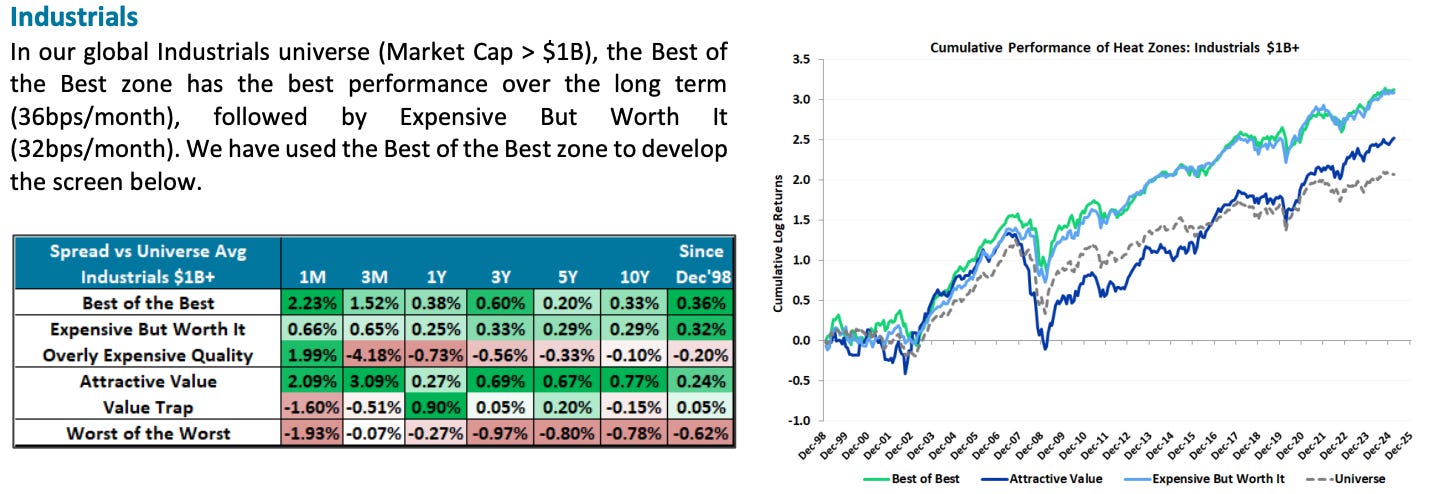
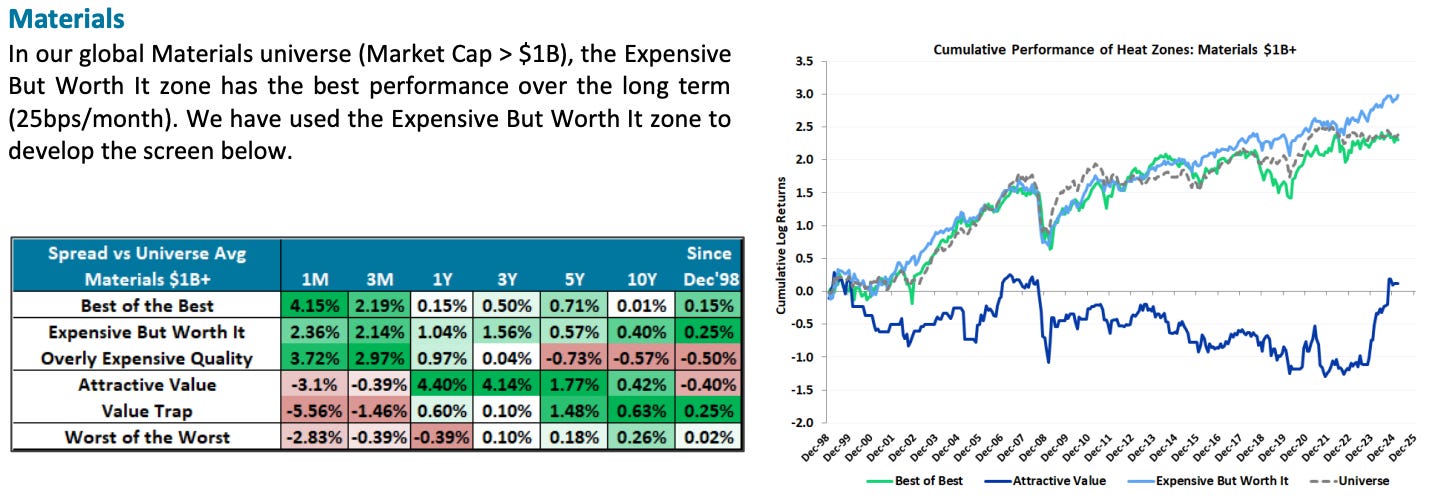
Below we show the attractive zones’ performance over time for our global sectors.


In our monthly PRV Factor Reports (U.S., Global) we provide historical performance for our HEAT Map Zones and frequently include the HEAT Map in our sector reports, industry snapshots, and other screens.
The Valuation Model is a novel framework in measuring, analysing, projecting, and valuing a firm’s underlying economic profit rather than its accounting profit. With coverage of 21,000 public companies, this solution enables investors to measure, analyse, and value corporate performance and generate informed investing decisions.

Screening & Idea Generation: Use the PRV reports to narrow the universe of investable ideas to those that are likely to outperform using an objective investment framework.
Single / Multiple Stock Analysis: Analyse the overall PRV profitability of a company and value the company with unique metrics.
Portfolio Analysis: View a fund’s exposure to PRV relative to a benchmark.

The weekly research reports allow investors to parse through thousands of companies globally with comparable accounting adjustments to drive informed investment decision-making on a systematic basis.
Each week we produce 5-7 timely and actionable reports to highlight key themes, trends, and opportunities from the framework. These reports are aggregated into our Weekly Roundup and sent to clients with priority. Reports can be accessed through this publication, which we will use to build our research catalogue to allow for a historical perspective and point-in-time reviews.
UNDERSTANDING A COMPANY IN THE PRV FRAMEWORK

PRV Margin (red line): Above (below) zero = company achieving better (worse) than cost of capital. Increasing (decreasing) PRV Margin indicates a company has improving (declining) operating profit and/or getting more (less) efficient with assets.
PRV Momentum (blue line): Measures incremental growth in economic value add. Positive (negative) PRV Momentum indicates the company is generating (destroying) incremental value.
PRV Shock (slope of blue line): Measure of acceleration (deceleration) of PRV Momentum; critical for determining Inflection points in a business model.
DRIVERS OF PRV

The three drivers of PRV are EBITDA Margin, Capital Intensity, and sales growth.
EBITDA Margin (blue line) excludes rent expense, Ad & Promo expense, and R&D expense (which are all capitalised).
Capital Intensity = working capital, net PP&E, and intangibles (including capitalised Ad & Promo and R&D), assessed a charge at the cost of capital and scaled to sales. Declining (increasing) Productive Capital charges (red line) = higher (lower) asset efficiency.
The gray shaded areas represent year-over-year sales growth.
BRING THE PRV FRAMEWORK INTO YOUR INVESTMENT WORKFLOW
Our Valuation Model provides investors with a differentiated approach to the investment decision process.
SUPERIOR TO TRADITIONAL MEASURES OF PROFIT: PRV cuts through accounting distortions and charges for the use of capital.
STYLE AGNOSTIC: Provides an unbiased view of Quality, Value, and Growth investment opportunities.
LEADING INDICATORS: PRV Metrics provide information that can be tied to future share price performance.
CONSISTENT, TRANSPARENT FRAMEWORK: Comparable across “all” companies, industries, and countries.
GLOBAL COVERAGE: Coverage spans 21,000 companies globally, with historical data going back two decades.
Through leading research and analytics, our Valuation Model gives investors insight into factor performance, themes, and other observations within a company or industry - delivering a simple and transparent model and a measure of true valuation for value and growth investors.
