We ended last week and started this week looking at this chart ...
The downward trendline in the S&P broke yesterday.
A similar trendline in the Nasdaq also broke.
The Dow is above the 200-day moving average, and has been for two months.
German stocks broke out of the downtrend a little more than two months ago, and now trade 27% higher (from the lows).
British stocks are just a little more than 1% off all-time highs.
And as we discussed yesterday, Chinese stocks are on the move. Several catalysts have lined up to drive both domestic and global growth, not the least of which is the end of zero covid policy.
So, all of this, and we are a little more than a week away from an event that has been the sentiment spoiler for much of the past year: another Fed meeting.
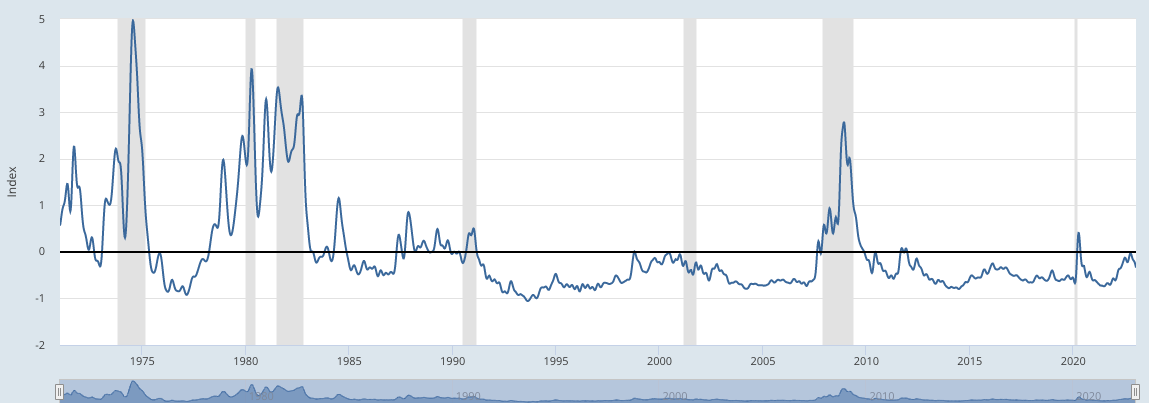
Since August, the Fed has made a clear effort, through rate hikes, guidance and threats, to tighten financial conditions. Yet, the Chicago Fed's National Financial Conditions Index (which measures credit, risk and leverage) is just about where it was when the Fed started raising interest rates.
And if you look at a chart of that index (below), you can see what today's level looks like (far right on the chart), relative to the levels in each of the past seven recessions (indicated by the shaded gray areas).
It's not close to looking like a recession.
Now, despite this setup above, the Fed has worked hard to quash any bubbling up of optimism along the path of the past year.
They've left nothing on the table. With all of the bullets they've fired, it's hard to imagine how, at this stage, they could negatively surprise markets next week.
They've already told us they want to take the Fed Funds rate another 75-100 basis points higher.
They've already dialed down their forecast on economic growth to almost nothing (just 0.5% for 2023).
They've told us they think unemployment is going a percentage point higher.
This, as the very inflation they profess to still be fighting most recently printed in negative territory (i.e. deflation from November to December);
The monthly change in prices over the past seven months averages to just 0.12%.
Annualize that, and inflation has been running below the Fed's 2% inflation target, for many months now.
We'll head into next week's meeting with a GDP report, due this Thursday, that will show an economy that grew at a better than 3% annual rate last quarter.
Bottom line: The Fed will have a very difficult time coming up with something to damage the momentum in markets.
At The GRYNING Portfolio the focus is impartial research to successfully navigate markets. The Dashboard (sample shown below) research guides clients’ strategic positioning and risk management, encompassing 60 individual tickers & 21 market ratio’s to provide a full martket overview.
As a snip-it, I would draw your attention to the Trend column, where Blue represents Risk On (Bull) and Pink represents Risk Off (Bear), with the date showing when the current sentiment came into play. Below I show $SPX from last year, annotated with just the trend model, entries and exits assumed a full day after the dashboard is delivered.
Join The GRYNING Portfolio, where for less than 0.50 per ticker per month, you access institutional grade model’s to back your trades.


