TL;DR
How we identify trends.
Visualisation of forecasts.
As market participants, we are trying to find patterns in the chaos. While "past performance is no guarantee of future results", history can be useful in guiding us through the perplexities of the present. The key is how you frame it.
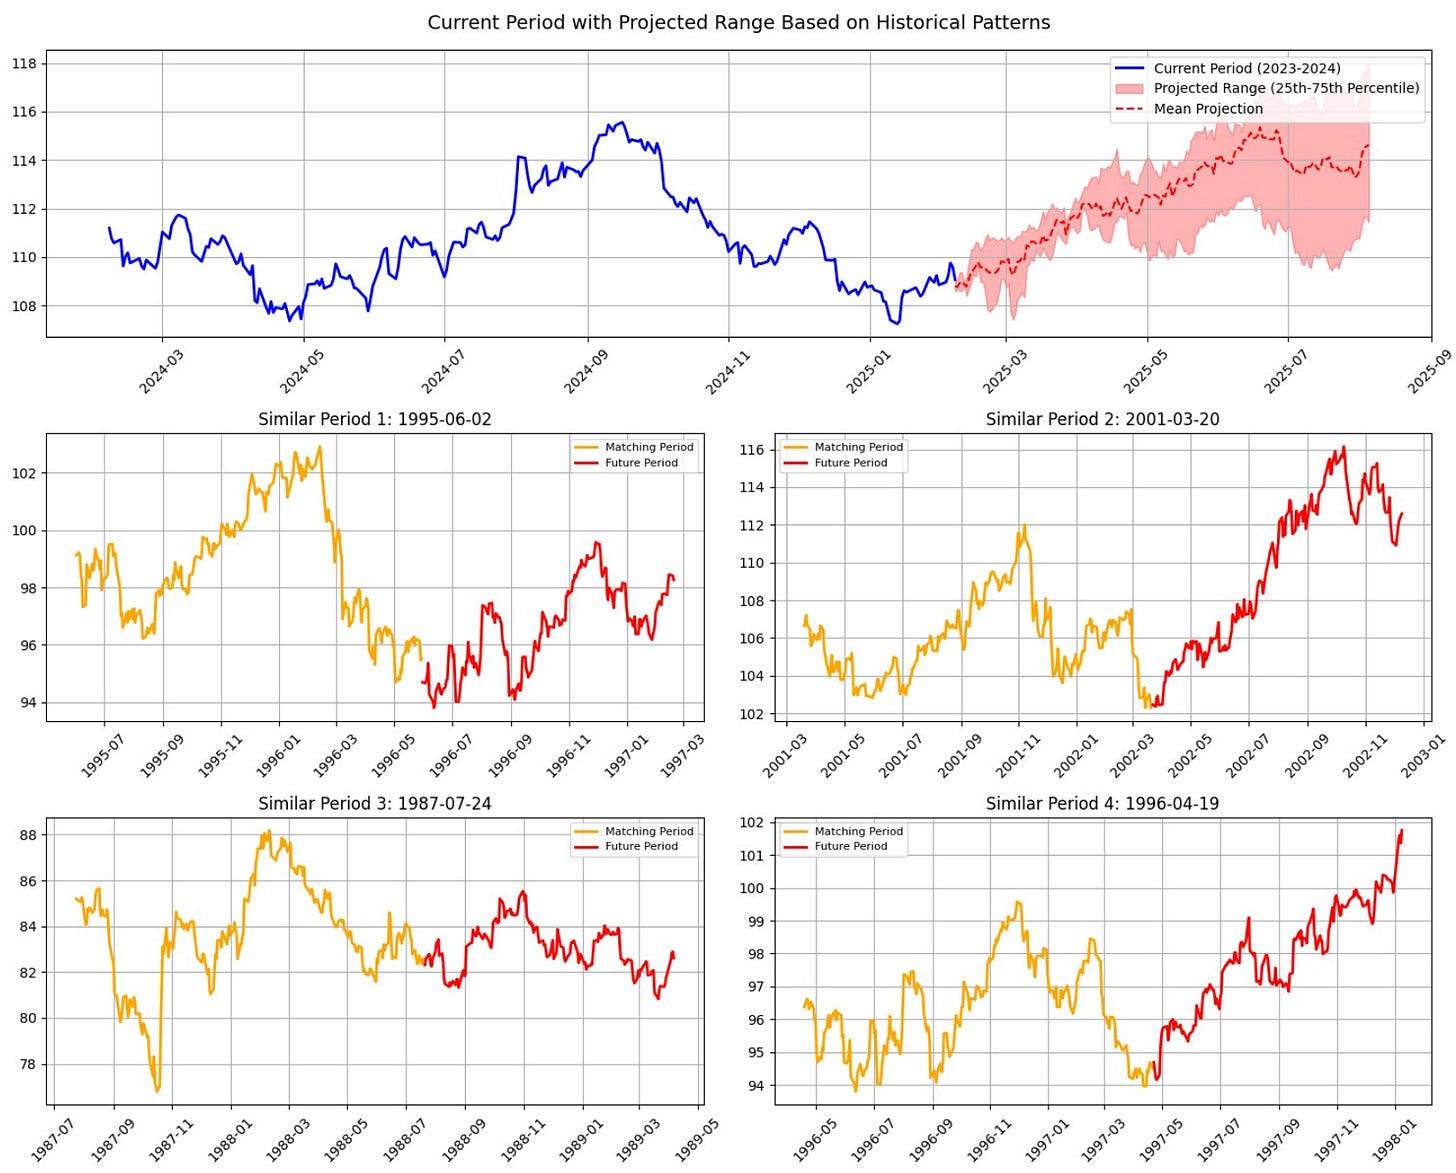
We look for comparable historical asset price patterns - origins of which lie in the tendencies of social networks and specifically imitative behaviours - to help predict future returns. The intuition is that past price movements can be similar to those of the present, but their pace and duration might vary.
Traditional technical analysis techniques can be too rigid in how “similarity” is defined. For our models, price movements need to be lined up in terms of both the shape and the rhythm to enable more actionable takeaways. By taking into account social dynamics - the hierarchical interactions of traders prone to mimic their counterparts - our model aims to quantify critical points that manifest when opinions converge.
Market prices can react sharply to clusters of investors altering their stance. We look to identify tactical market tops and bottoms and use analogues to add conviction to directional views. Put together, the two models produce this:
nb: We are currently developing our models into an interactive, invite only, platform - chart shown above - which we will release to members in due course. Your membership contributes directly to the development of the platform, once stable & robust (ca. 6 months), invites will be sent out to past & current members only.
Together our models flag both trend-continuation and/or mean-reversion patterns, resulting in a model with a very low correlation to price and other traditional technical analysis indicators.
Due to this low correlation, it can potentially add extra information and conviction to tactical trading signals.
We are designed for those who have investment performance responsibility or are managing financial risks. A membership provides indicators and diagnostics to help assess the current state of financial markets across various asset classes and regions.
Please find below two Chartbook’s with actionable trade insights highlighting the models discussed above, alongside our weekly Commodity Chartbook (global trend report & daily summary are not shown below).
Members can access the full range of information and actionable content.


