As we end the week, let's take a look at a few charts.
First, here's a look at the performance of global asset prices over the past week.
You'll notice, despite all of the financial media hand wringing over stocks - related to the Fed meeting - the S&P 500 (the proxy for global stability and risk appetite) was only down less than 1/2 percent on the week.
Other notables: The VIX (also known as the market's 'fear gauge') was down on the week, not up.
Crude oil was up more than 5% on the week - not exactly a signal of economic slowdown, but then again, crude is now trading on a supply shortage, brought to us by the design of global (and domestic) policymakers.
On that front, it's important to remember how we started the week. On Monday morning, it was reported that the European Union was ready to propose a Russian oil embargo, and Germany was now on board. That triggered a 3% decline in the S&P 500 over just a few hours (on Monday).
Crude finished up nearly 10% from the Monday morning levels. Here's how crude looks heading into the weekend - a bullish “technical” breakout.
NB: “technical” simply refers to chart art - visual aids for quick reference. There is nothing technical about drawing random lines connecting arbitrary data points.
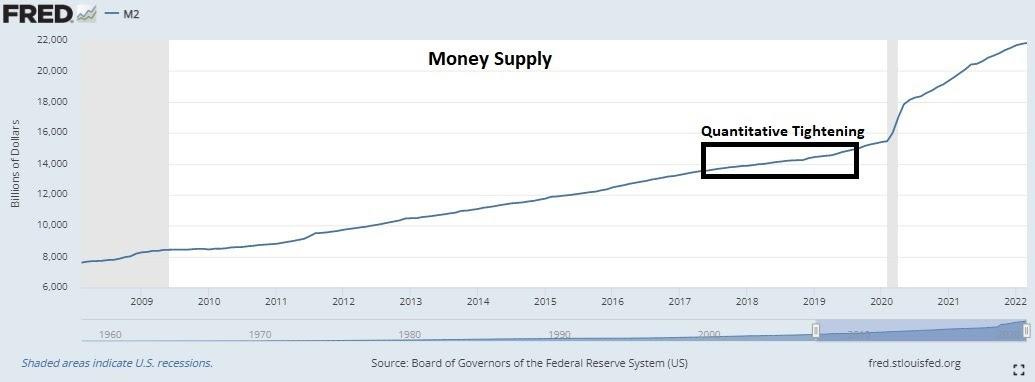
Finally, let's take a look at money supply. Remember, the policies surrounding the pandemic response, ballooned the money supply by over $6 trillion.
Now that the Fed has started quantitative tightening (i.e. reversing QE), some are expecting the money supply to shrink.
While money may be extracted from bank reserves (by changing a digital number to a smaller number with a keystroke), it didn't show the desired effect on actual money supply during the Fed's 2017-2019 QT program. As you can see in the chart above, money supply grew during the period (by a trillion dollars).
What's the point? The rate of change in prices should subside, but the level of prices, caused by this tidal wave of new money, isn't going anywhere.


