Tensions Rising
Stocks in the US were trading slightly higher on Thursday as encouraging corporate earnings and cooling inflation offset lingering trade uncertainties.
The S&P 500 and Nasdaq each rose around 0.2%, lifted by a 13% surge in Oracle shares following strong quarterly results and an upbeat forecast for cloud growth driven by AI demand.
Economic data showed further signs of easing inflation, with the Producer Price Index rising just 0.1% in May, boosting hopes for a Federal Reserve rate cut later this year.
President Trump reiterated his push for a significant rate cut and confirmed plans to send tariff-related letters to US trading partners, while still expressing confidence in a trade framework with China.
Among sectors, technology, utilities and health outperformed, while communication services, consumer discretionary and industrials led losses.
When we look back to April of last year, Israel struck the Iranian consulate in Syria. That triggered a stock market decline of about 7% over the next 18 days, on the prospects of global war.
Gold went up 8% during the period. Silver went up 20%.
But oil went up just five bucks from $82 to $87. And while U.S. Treasuries are safe haven assets in times of risk aversion, the 10-year was sold, not bought (price down/yield up). The 10-year yield ran UP 50 basis points (to 4.70%).
This reaction all reversed after Israel de-escalated – ending tit-for-tat attacks.
Fast forward 14 months, and (at the time of writing: 07:45 GMT+1, Fri 13, 2025) we now have the response from Israel that the markets were bracing for a year ago. Iran has warned this will engulf the region in war and drag U.S. forces into the line of fire.
The chart above is where we stood as U.S. markets closed. The futures markets have begun to tell a story: the first moves – stocks down, gold up.
Oil, this time, is up big -- +11% -- though starting from a much lower base (high $60s vs. $80s last year).
And the first move in yields was down, but now ticking up. Will we see another run UP in yields, on the prospects of inflationary outcomes: an oil price shock and potentially a government spending response?
The Global Trend Report is designed to identify asset classes and sectors exhibiting potentially unsustainable behaviour and assess the extent of their crash risks, regime shift potential, and broader systemic vulnerabilities.
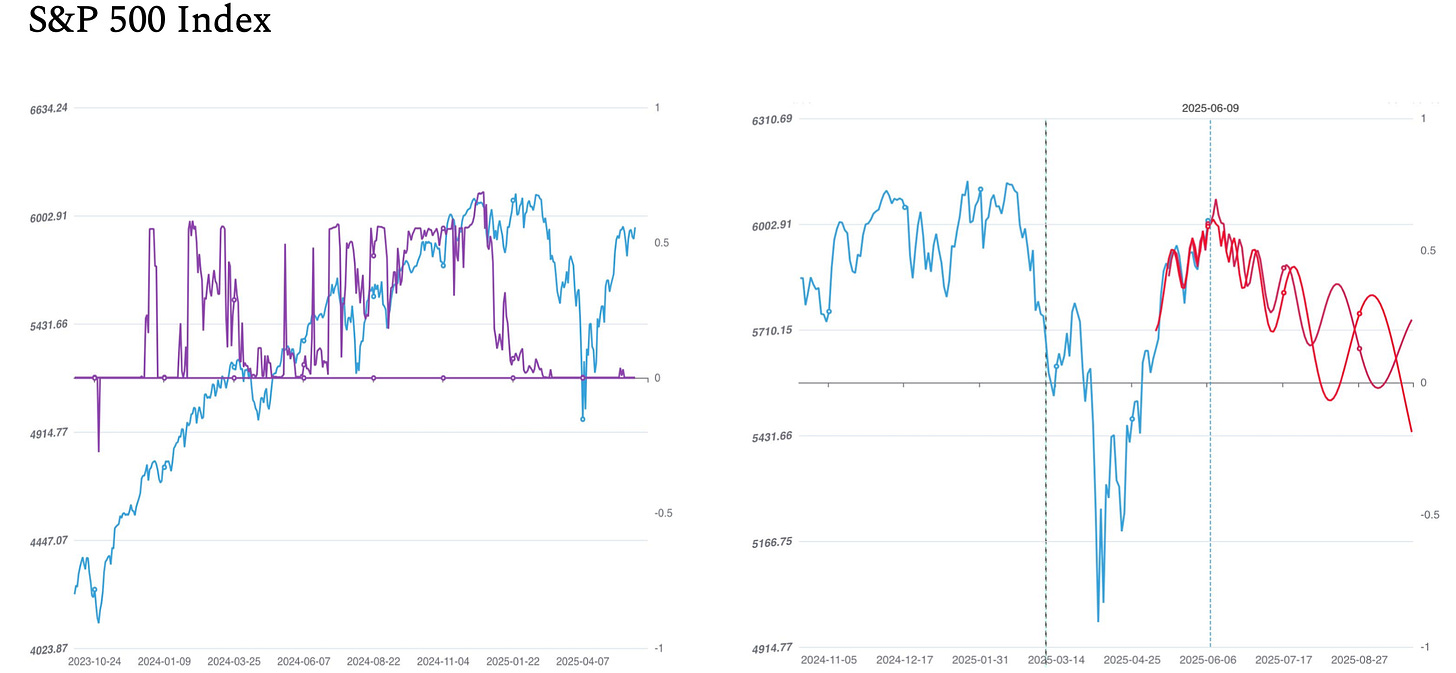
Become a member to get exclusive access to our comprehensive monthly reports, plus the powerful features (indicators, scenarios, and distributions of critical times) for over 1,000 assets. The slide below shows the future price scenario (chart on the right) for the S&P500 index, generated by our model on 09 June 25 (vertical light blue dotted line).
Our reports have guided us for a number of years and have been continuously fine-tuned. Notice the red box from our Feb 2020 Summary:
Become a member and access institutional-grade analysis.


