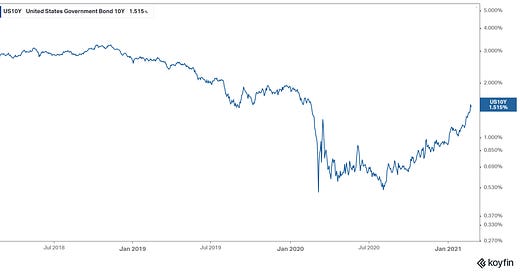
Stocks took a small “hit” yesterday - it's about inflation - and the signal is in this chart…
This move in the 10-year is clearly quickening. With yeilds having gone from 1% to 1.6% in less than a month - the market's judgement on the impact of the additional $2 trillion package coming down the line from a democrat-led Congress. That interpretation is: inflationary at best, and recklessly extravagant, at worst.
U.S. media and politicians have pretended that there is some bipartisan debate and negotiation going on, on Capitol Hill, about the size and scope of the latest fiscal "stimulus" proposal. This package has been (all but) signed, sealed and delivered since the Georgia Senate elections gave control of the Senate to the democrats. The 50/50 split in the Senate, gives the deciding vote on legislation to the Vice President, Kamala Harris, it's a done deal.
So even though the $900 billion aid package passed in late December is just in the early stages of being disbursed, another $2 trillion of deficit spending is being poured on the liquidity fire.
Remember, Jay Powell just admitted this week that the economy could run as hot as 6% growth this year - that's before any new stimulus. So, with the onslaught of more money, we should expect nominal growth and nominal returns this year to surprise to the upside (maybe double digits), but so will inflation.
This is the chart to watch as the next spending package gets rammed through...


