Structural Trend
The S&P 500 rose about 0.1% and the Dow Jones gained 0.3%, with both indexes notching a fifth consecutive session of gains, while the Nasdaq 100 slipped 0.1%, weighed by early losses before a late-session rebound in Big Tech.
Although earnings have largely beaten expectations, tariff-related uncertainty has led many companies to lower guidance for the second quarter.
Treasury Secretary Scott Bessent reiterated that it was "up to China" to de-escalate trade tensions while signaling progress on other trade fronts.
Key reports on GDP, inflation, and jobs due this week are expected to offer fresh insight into the economic outlook.
Monthly Global Trend Report & weekly Commodity Chartbook
We heard from Telsa and Google last week, on Q1 earnings. And we'll hear from four more tech giants this week.
Just months ago there were questions about whether the huge capex plans from this group would go forward, after the DeepSeek disruption of late January. But they didn't flinch. Instead, they all pressed the accelerator. In aggregate, they announced $300 billion worth of capex planned for 2025. Importantly, all in response to "signals of demand."
Where do they stand now?
For the most recent quarter, Google and Tesla reaffirmed the big capex plans. We should expect more of the same from the cohort this week.
From that point, the focus will turn to Nvidia's earnings, which will come in late May.
The Trump administration has recently blocked Nvidia's exports to China, which is thought to be about a 10%-15% revenue hit. But remember, the headwind for Nvidia is supply, not demand.
On that note, Nvidia announced two weeks ago that new capacity for its most advanced chips has just started production in Arizona, and production in Texas is due in 12-15 months. That will add to global chipmaking capacity, which means Nvidia will be able to fulfil more of the demand backlog.
Amazon's CEO (Andy Jassy) has said that the AI business could be growing faster if not for chip supply constraints. So, this U.S. onshoring of chipmaking will effectively press the accelerator on the AI revolution.
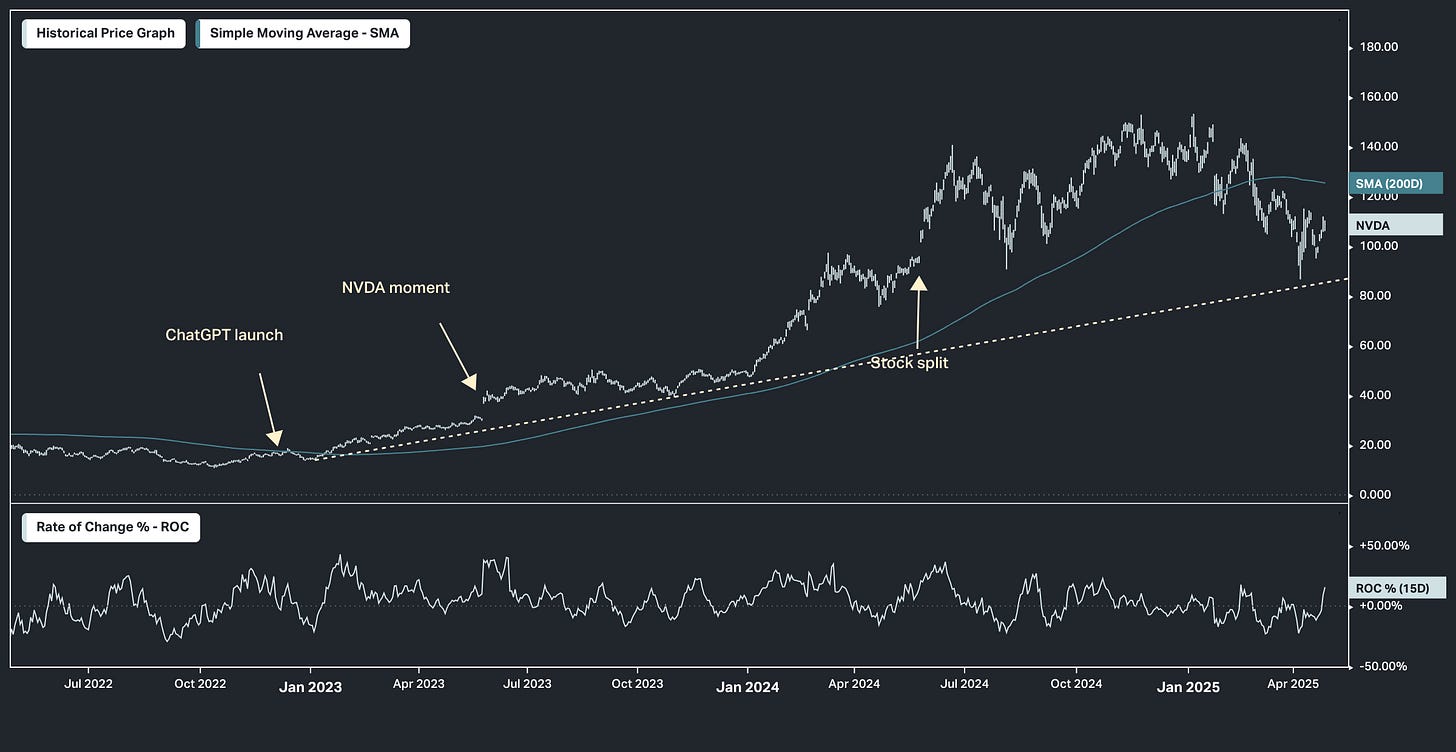
With all of this, Nvidia remains the most important company in the world, which makes the trend in this chart below (sparked by the "ChatGPT moment") the most informative about the current stock market environment: it's a correction within a long-term structural trend.
Relative to the ChatGPT moment, Nvidia is growing revenue three times faster, is twice as profitable, and yet its shares are cheaper (forward P/E of 24). Meanwhile, Nvidia’s market position has never been more dominant, and demand has never been more insatiable.
We released the Commodities Chartbook to accompany the Global Trend Report for members of The GRYNING Times. Become a member to access the full information package.
I wanted to highlight what appeared to be one of the more interesting charts in the commodity space. The chart below is the mismatch indicator for NatGas, which identifies positioning mismatches (bright dot in yellow box) between the net number of individual speculative traders and their net speculative futures position.
These points frequently intersect with price inflection points and can be useful trading signals. They are also associated with periods of heightened volatility and elevated newsflow in the market.
Mismatches can be very difficult to interpret and ideally need to be viewed in the context of broader market dynamics, as it is often unclear how prices will behave when they occur. They are very sensitive and should be considered useful warning signs that are able to detect potential shifts in positioning and sentiment that many other indicators will fail to identify early enough.
Because they are difficult to read mismatch signals are really useful in combination with other positioning indicators such as the Dry Powder. This is last weeks Dry Powder for NatGas Contracts:
We are going to keep adding pages to the real asset chartbook, but our first task over the next 6 months, is to add details to the chartbook that attempt to highlight the significance and importance of any of the measures.
The Commodity Chartbook and/or Global Trend Report with daily updates are available as individual packages. Please click on the button below to sign up to an individual offering:
When you sign up, we will send you an email to confirm your research preference.


