Stocks Lower
US stocks declined sharply on Tuesday, posting their worst day since August 5, driven by economic concerns and a significant selloff in tech stocks.
The S&P 500 tumbled by 2.1% and the tech-heavy Nasdaq plummeted 3.1% while the Dow Jones shed 625 points.
Nvidia, a leader in the AI-driven market rally, fell 9.5%, dragging down other chipmakers like Broadcom (-6.2%), Qualcomm (-6.9%), and Micron (-8%).
Communication services stocks also underperformed, with Alphabet and Netflix falling 3.7% each.
Economic data added to the market's woes, with subdued factory activity in August raising concerns about the strength of the economy.
We have a big jobs report on Friday.
The result of the Fed's very restrictive policy rate has been damage to the labour market. That damage has been revealed in the rate-of-change at which the unemployment rate is rising. It's at a speed that is consistent with the past four recessions.
And with that, the weak jobs data that was reported early last month (Aug. 2) was the signal to markets that the Fed had arrogantly held rates too high for too long — and that perhaps aggressive rate cuts were coming as the Fed finds itself cleaning up another policy mistake.
What else was revealed that day?
The Fed's stubbornly hawkish policy over the past two-and-a-half years has created a vulnerability in global markets.
It was the persistent telegraphing by the Fed of high and stable relative interest rates in the U.S. that attracted capital from around the world, particularly from Japan (where investors borrowed yen cheaply and invested in higher yielding and high return U.S. assets, i.e. "the carry trade").
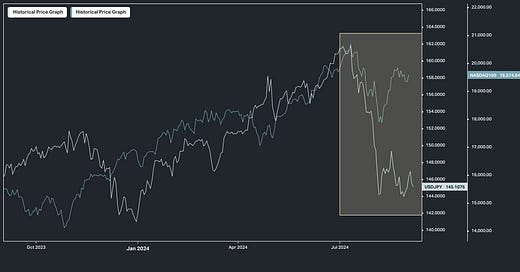
With that, we looked at the dollar/yen exchange rate alongside the Nasdaq chart heading into that jobs report last month and talked about the prospects of that trade reversing…
As you can also see, the two have, no coincidence, tracked closely.
The story of the chart is;
borrowing yen for (effectively) free,
converting that yen to dollars (dollar/yen goes up),
investing those dollars in the highest quality dollar-denominated assets (U.S. Treasury and the big tech oligopoly stocks).
As we know, the weak labour market picture early last month did indeed trigger a sharp unwind of this trade. And here is the update of this chart…
While stocks have made a full V-shaped recovery since that sharp unwind, USDJPY has not.
And with another check-up on the health of the job market coming down the line this week, this divergence (within the yellow box in the chart above) looks likely to close in the direction of the light green line (i.e., stocks lower).


