Recap: Going into the August inflation report, we've had a 30% rise in oil prices and a 55 basis point move in the 10-year yield, all since the end of the first half (the end of June).
Meanwhile, stocks (Nasdaq, S&P 500, DJIA) are left virtually unchanged over the same period.
With the inflation data now behind us, is it time for stocks to make a strong run into the end of the year? Maybe.
Stocks are trading at 18.6 times next year's earnings (forward twelve months). That's more expensive than the long-term average of around 16 times, but it's cheaper than the average trailing twelve month P/E of the past 30 years which is north of 20 (even if we exclude the high multiple years following recession).
If we apply a P/E of 20x for earnings expected over the next twelve months, we get a price target on the S&P 500 that implies another 7-8% higher (from current levels).
With that in mind, let's revisit the midterm election year analogue we've talked about since last November . . .
Going back to 1950, there has never been a 12-month period, following a midterm election, in which stocks were down.
The average 12-month return, following the eighteen midterm-elections of the past seventy years, was +16.3% (about double the long-term average return of the S&P 500).
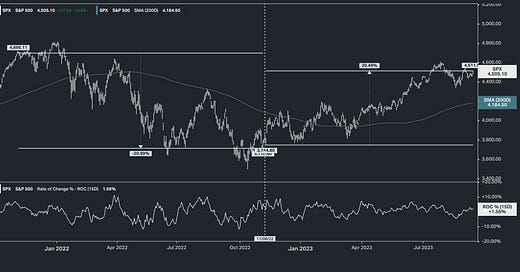
This phenomenon has been playing out. The S&P 500 opened at 3,750 on November 8th, 2022 (election day). Today it trades 4,510. That's a rise of 20% over the past ten months.
What was the best 12-month period following a midterm election (over the past eighteen periods observed)? It was under Kennedy - stocks rose 31% in the 12-months following the 1962 midterm election.
Interestingly, the worse stocks did in the 12-months prior to the midterm elections (over the 70-year period observed), the better they did after. In the current case, stocks were down 22% prior to last year's election.


