Markets are at critical turning points with very mixed reads, as the bullets highlight below. A case could be made for strong mean reversion or a continued move lower.
QIS Members will find the Edge chartbook and the Options Spread trade idea’s for the day in your inbox.
Risk On
The weekly trends in the NASDAQ, S&P, and Dow remain in bull phases, while IWM is in a warning phase. Friday’s reversal in the S&P could be bullish if confirmed. (+)
European equities rallied strong this week. (+)
Both emerging markets and more established foreign equities exploded to the upside, attacking the all-time highs set back in 2008. (+)
Neutral
On the daily charts, the indexes appear to be breaking down, though all four indexes are oversold on Real Motion and could be poised for a bounce. The S&P tested it’s 200-Day Moving Average and closed slightly above it. IWM is in a distribution phase. (=)
The number of stocks above key moving averages may have reversed course in the S&P and its also looking like potential bottoming action in IWM. If S&P we can clear the 50 percent level on both the 10-Day and 50-Day, that could be a positive sign. (=)
Semi-conductors entered into a bear phase, though it is oversold on both real motion and price. Biotech held up in a recovery phase and outperformed the S&P over the last couple weeks. (=)
The moving average of the number of stocks above key moving averages, on both the 50 and 200 are neutral, which considering the market action, is neutral for the markets. This is for the S&P, NASDAQ, and Dow. (=)
Sector Summary
These 11 basic sector ETFs will keep you in the primary market trends if you follow the leaders on a 6-month basis. Use the Phases and 3-month % Change for more active trading.
This table tracks key performance and indicator data for the major U.S. sector ETFs. In addition to seeing the daily price change, highs, lows, and volume, we also display the market phase and longer-term price performance. This can be used to identify key performance stats for any individual instrument or to access how they are performing overall as a group.
Are the majority in the same phase? Are there any phase changes? (Indicated by an "!" and highlighted phase)
Market Hot Spots
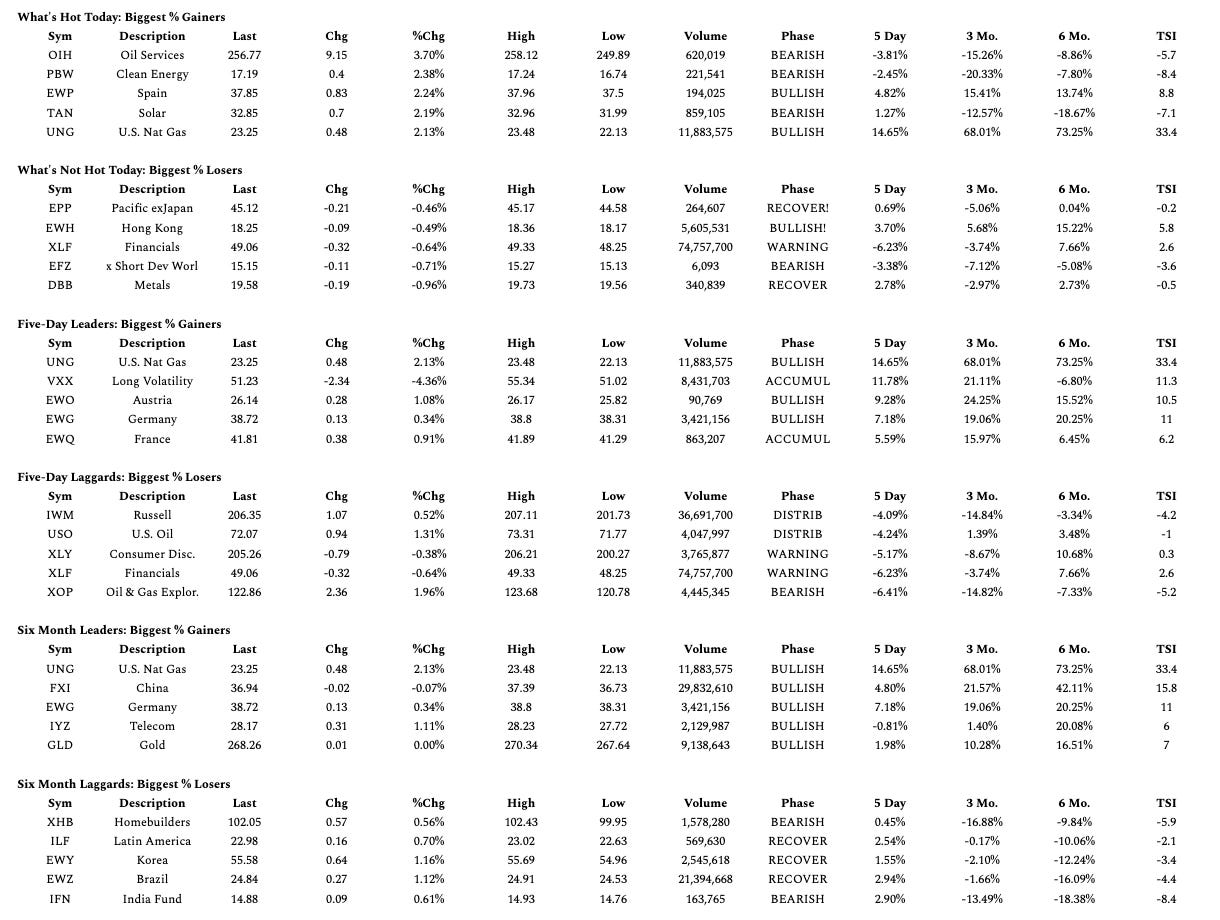
What's hot today? What dropped today? This is a source of new trades ideas when today's action creates an opportunity in the context of the Phase, 3-month, or 6-month trend!
This table displays the 5 biggest daily percentage gainers and losers as well as the 5 biggest six-month percentage gainers and losers as well as other key market data for those symbols. The market hotspots leaderboards are taken from a list of over 130 key and representative ETFs.
The daily gainers and losers can help you identify short-term market trends that might continue.
The six-month gainers and losers can help you identify ETFs with longer term strength and weakness.
Extreme or contrary moves in both long and short-term periods can point toward potentially overbought or oversold situations.


