Rhymes
Stocks in the US climbed on Monday as optimism around easing geopolitical tensions boosted investor sentiment.
The S&P 500 rose 0.9%, the Dow gained 317 points, or 0.7%, and the Nasdaq rallied 1.4%, bouncing back from Friday’s steep declines.
Gains were led by tech and consumer discretionary stocks, as Meta (2.9%), Palantir (3%), and Tesla (1.2%) outperformed while energy share decline after oil prices dropped nearly 2%.
Among other stocks, US Steel jumped 5.1% after President Trump gave formal approval to Nippon Steel’s $14.1 billion acquisition of the company.
Roku surged 10.4% on news of a new advertising partnership with Amazon Ads.
Six years ago, almost to the day, there was an ebb and flow of U.S./China trade negotiations. The Fed was stubbornly holding rates high in the face of falling (sub 2%) inflation with a monetary policy meeting approaching. The U.S. was executing a "maximum pressure" campaign on Iran. And Iran was threatening to choke off 20% of global oil trade in the Strait of Hormuz.
So, this June rhymes.
What doesn't rhyme is the way the Fed viewed trade policy uncertainty, at the time.
In 2019, they viewed it as a downside risk to growth - demand destruction with deflationary pressures. That ultimately resulted in the Fed's dovish pivot in June, and then a rate cut in July.
Among the reasons cited, disappointing foreign growth, "notably in the euro area and China."
Fast forward six years, and the economies in Europe and China are both weaker than they were in 2019.
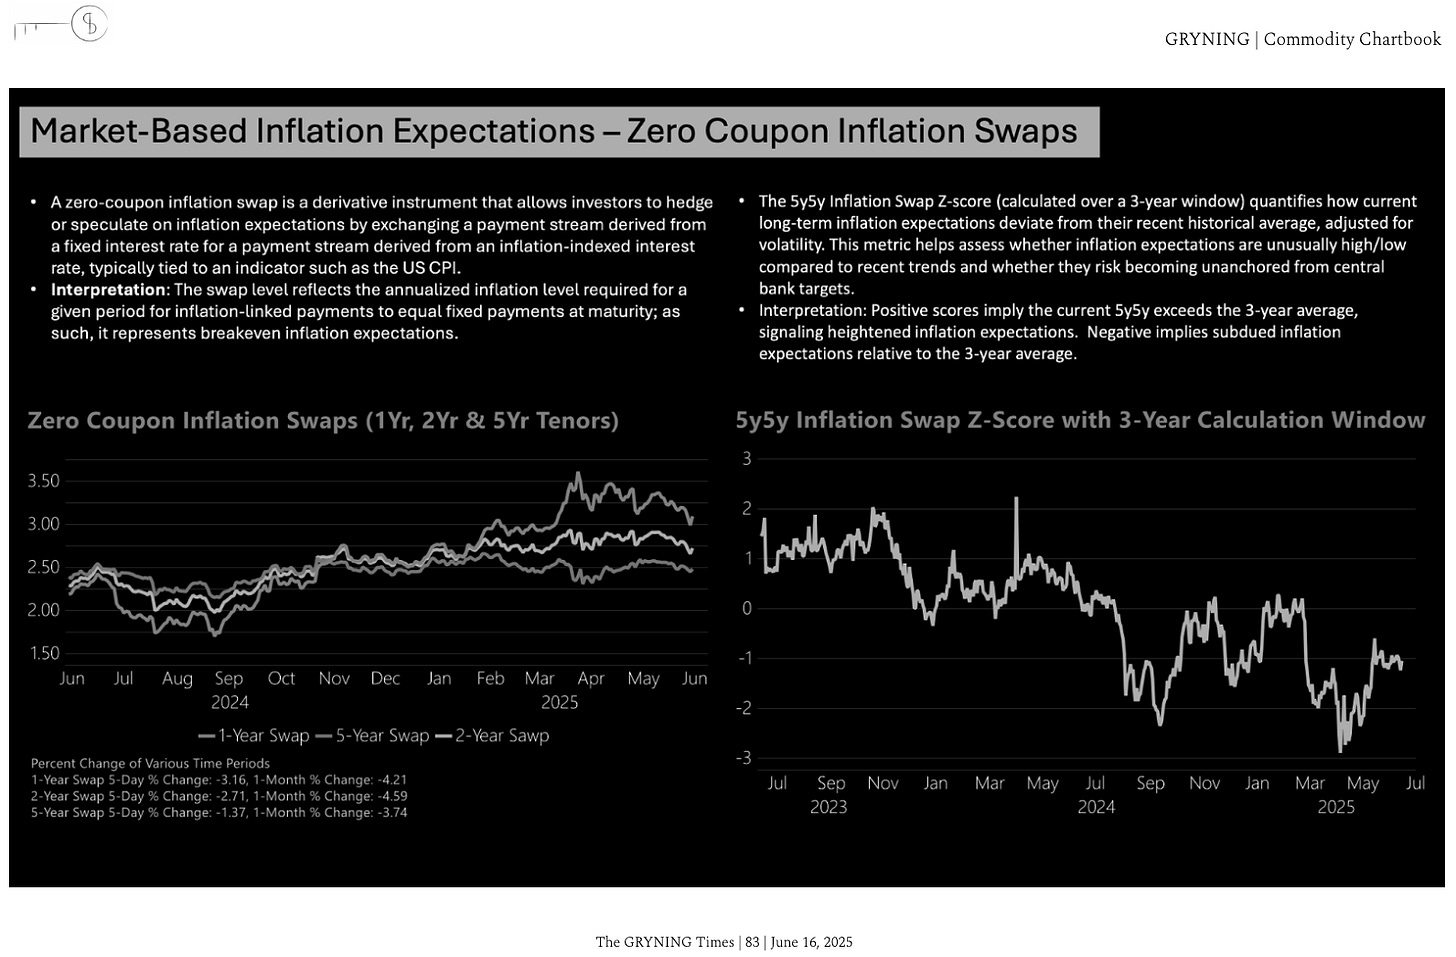
Inflation has fallen to a tenth of a point from the Fed's 2% target. And yet this time, the Fed sees trade uncertainty as inflationary - a potential supply shock, not a demand one.
How wrong might they be?
Six years ago, the first rate cut, was followed by a second, a third, the ending of quantitative tightening and the beginning of another round of balance sheet expansion (i.e. a return to quantitative easing) - all of it within four months.
GRYNING | Global Trend Report - where we give you market turning points. The price chart above for NVDA (grey) shows our Negative Trend Indicator (black) - vertical lines below 0 - where a spike below -0.5 coincides with trend exhaustion, giving you a high probability of a bullish trend reversal.
To celebrate 5 years on Substack, you have the ability to access our Institutional Offering on a monthly basis; that’s daily trend & future scenario analysis for 100 tickers of your choice!
nb: The macro slides in this post are from our weekly Commodity Chartbook, included within the Global Trend Report offering.


