


Research Roundup: May 29, 2025


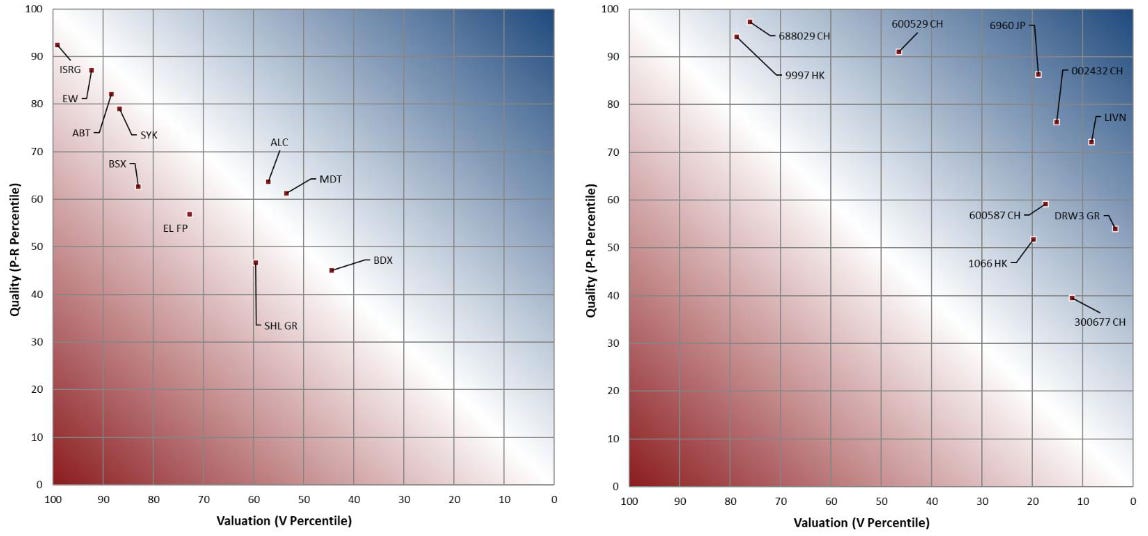
Our HEAT map is the visual trade-off between Quality and Valuation: companies in the favourable (blue) area offer higher quality and/or cheaper valuation than those in the unfavourable (red) area.

The reports highlighted in this series are sent out to clients on Monday at 07:00 EST. More information on the PRV framework can be found here.
Chart of the Week: Removing the Low-Growth Names
Our Chart of the Week graphs the performance of the Russell 2000 Growth Index when the names we consider low growth are removed. The dark blue line is the monthly returns of the unfiltered index. The ‘P2 > 20’ line removes the worst quintile of Growth from the index. The ‘P2 > 40’ line removes the two lowest-growth quintiles from the index, and ‘P2 > 60’ removes the three lowest-growth quintiles. In each scenario, we rebalance the remaining holdings proportionally.

Names in the News: ONEOK, Inc. (OKE) & Darden Restaurants, Inc. (DRI)
This week, we look at two large-cap names that got upgraded from ‘Hold’ to ‘Overweight’ in the US-relative PRV framework this week, OKE and DRI. OKE was upgraded on improving Quality, while DRI has seen its Valuation turn more favourable in recent months.

Industry Snapshot: Global Diversified Telecom Services
Fundamentals for the industry bottomed out in August last year, with Momentum (growth) approaching zero percent as of April. This trend reflects improving, but still negative, incremental value creation. The level of economic profitability has also improved over the last 9 months but remains around the lower end of the 10-year range. Investor expectations remain elevated as the market moves to pricing in a positive inflection in growth at a time when Fundamentals have already started improving.

Industry Snapshot: Global Health Care Equipment & Supplies
Incremental growth has improved to just under zero percent as the industry exhibits marginal improvements to incremental value creation, driven by strong top-line growth and improving EBITDA Margin. Aggregate economic profitability turned negative in early 2024 and has remained pressured over the last 12 months near 20-year lows. The industry looks unattractive from a PRV perspective as high Valuations remain a concern.
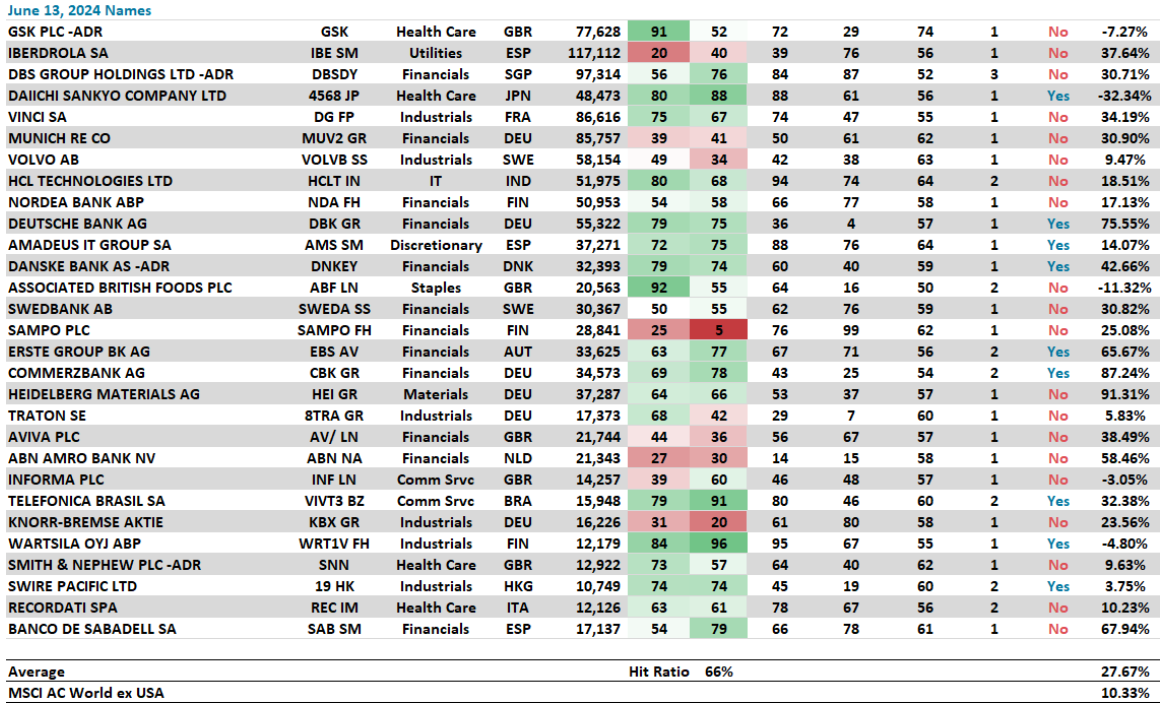
Better World: Good Growth for a Better World (Global ex U.S. Large Cap)
We identify attractive names in our Global ex U.S. Large Cap universe with strong growth scores (Profitability Trend, P2), attractive PRV, and strong ESG Performance Scores. The PRV framework compares a firm’s operational Quality to the Value paid in the market: the greater the disconnect between Quality and Value, the more favourable the stock. The table below shows how the names in our June Report have fared.
Buyer Beware: U.S. Large Cap
In contrast to our ‘Better World’ screens that identify high-Quality or cheap-Value names with strong ESG scores, this week we offer our ‘Buyer Beware’ report that looks at poor Quality, expensive Valuation, and low-ranked ESG companies in the U.S. These names are trading well ahead of their fundamentals and lag their industry peers in ESG performance.

Russell 2000 Growth Index: Dissecting Growth
We use our Profitability Trend (P2) factor to highlight disconnects between the Russell 2000 Growth Index and our view of high-growth companies. We provide a list of companies that are overweight in the Russell 2000 Growth Index that score low in our P2 factor and unattractive in PRV. We also provide a list of companies that are underweight in the Russell 2000 Growth Index but that we regard as high-growth stocks (high P2) with attractive PRV scores.
Quant Corner: May 22, 2025
PRV spreads were positive in Europe, Asia ex Japan, Japan, and the Global universe through the third week of May. Quality had been working everywhere in April but saw positive spreads in Europe, the U.K., AxJ, and Japan. Cheap Value outperformed expensive Value in all regions except the U.S. and the Global universes.

