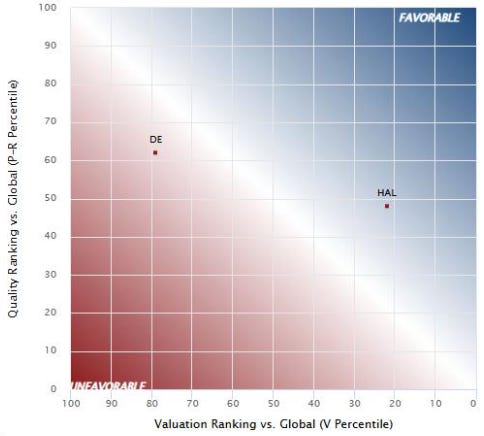
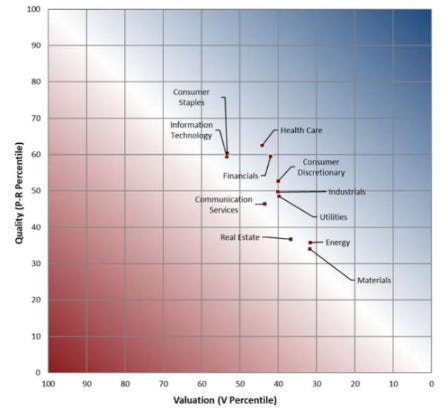
Our HEAT map is the visual trade-off between Quality and Valuation: companies in the favourable (blue) area offer higher quality and/or cheaper valuation than those in the unfavourable (red) area.
The reports highlighted in this series, a minimum of 20 per month, are sent out to clients on Monday at 07:00 EST. More information on the PRV framework can be found here.
Names in the News: HAL and DE
We cover two U.S. large cap names this week, HAL and DE.
HAL has seen a rise in its stock price in the last few trading sessions amidst a rise in crude prices on U.S.- China trade talks and a dip in Saudi Arabian crude supply to China.
DE recently reaffirmed its plans to scale operations further in Brazil. The firm expects sales of farm tractors and combines in Brazil to overtake those to Europe over the next decade, making it their second-biggest market.
EVA Growth Still Improving: Latest Quarterly Results
Fundamentals for the global aggregate have continued to improve through Q1. We have updated quarterly data for 5,638 firms with a market cap over $1bn and observe that out of the 11 sectors on a weighted average basis, 7 sectors have seen a pickup in Momentum (positive PRV Shock 1Q) over the past quarter. Nine of the 11 sectors have seen an expansion in Momentum post-inflection count, which looks at how many quarters there have been a positive or negative change in the direction for Momentum.
STOXX EURO 600: Sector Analysis
In our monthly factor reports and many of our macro reports, we provide a sector attractiveness table featuring the average PRV scores for sectors. Over 12 months, the attractive sectors outperform the unattractive sectors by 212bps on an annualised basis (results from December 2012 to May 2025). Report includes most attractive companies in Discretionary, Staples, Financials, and Utilities.
Industry Snapshot: Global Tires & Rubber
Fundamentals for the industry rolled over in August last year after 12 months of improvement, with Momentum (growth) turning negative in December, impacted by weak top-line growth and a contracting EBITDA Margin. Higher rubber prices through 2H 2024 contributed to elevated COGS, leading to pressured P&L Profitability. Some large cap firms have reported declining volume growth in North America and Europe for original equipment tires.
Quant Corner: June 16, 2025
PRV spreads were positive in Europe and Japan through the first weeks of June. Quality also worked in Europe and Japan while struggling elsewhere. Cheap Value outperformed expensive Value in all regions except Japan.
PRV Factor Report and Best of the Best Screen: Emerging Markets
In this report, we look at the performance of Quality, Value, and PRV for the Large Cap Emerging Markets ($5B Market Cap) over the last two years. The market performance spiked in early April and continued up through the first week of June, driven by high-Quality names. Value was tumbling before the market spike but picked up at the end of April and into May. PRV has been trending up most of the year.
The Valuation Model is a novel framework in measuring, analysing, projecting, and valuing a firm’s underlying economic profit rather than its accounting profit. With coverage of 21,000 public companies, this solution enables investors to measure, analyse, and value corporate performance and generate informed investing decisions.
A subscription gives you between 5 - 8 reports every Monday for a total for 4 weeks. Click on the button below to access our Valuation Model reports.


