


Summary
When markets crash, they tend to follow a ‘stylised’ pattern of pendulum-like sharp oscillations after the initial low is made.
Typically, we see ~4-8 weeks of price oscillations (large initially, dampening over time) and there is usually a re-test of the initial low at the end before a sustained rally can start.
This post-crash pattern should be used as a guide rather than a foolproof map. Major macro catalysts (e.g. Covid Fed intervention) can invalidate this pattern.
The key takeaway is that the bottoming process usually plays out over a few weeks and investors should expect a high likelihood that the initial lows are tested.
Seven market bottom trades, as identified by our Market Turning Points indicator — become a member to access the reports daily.
~4-8 Weeks of Price Oscillations
When markets crash, they tend to follow a ‘stylised’ pattern of pendulum-like sharp oscillations after the initial low is made. We revisit a useful framework to help navigate market crashes: harmonic-oscillation crash patterns. This stylised pattern helps to describe how systems return to equilibrium, like the swing of a pendulum.

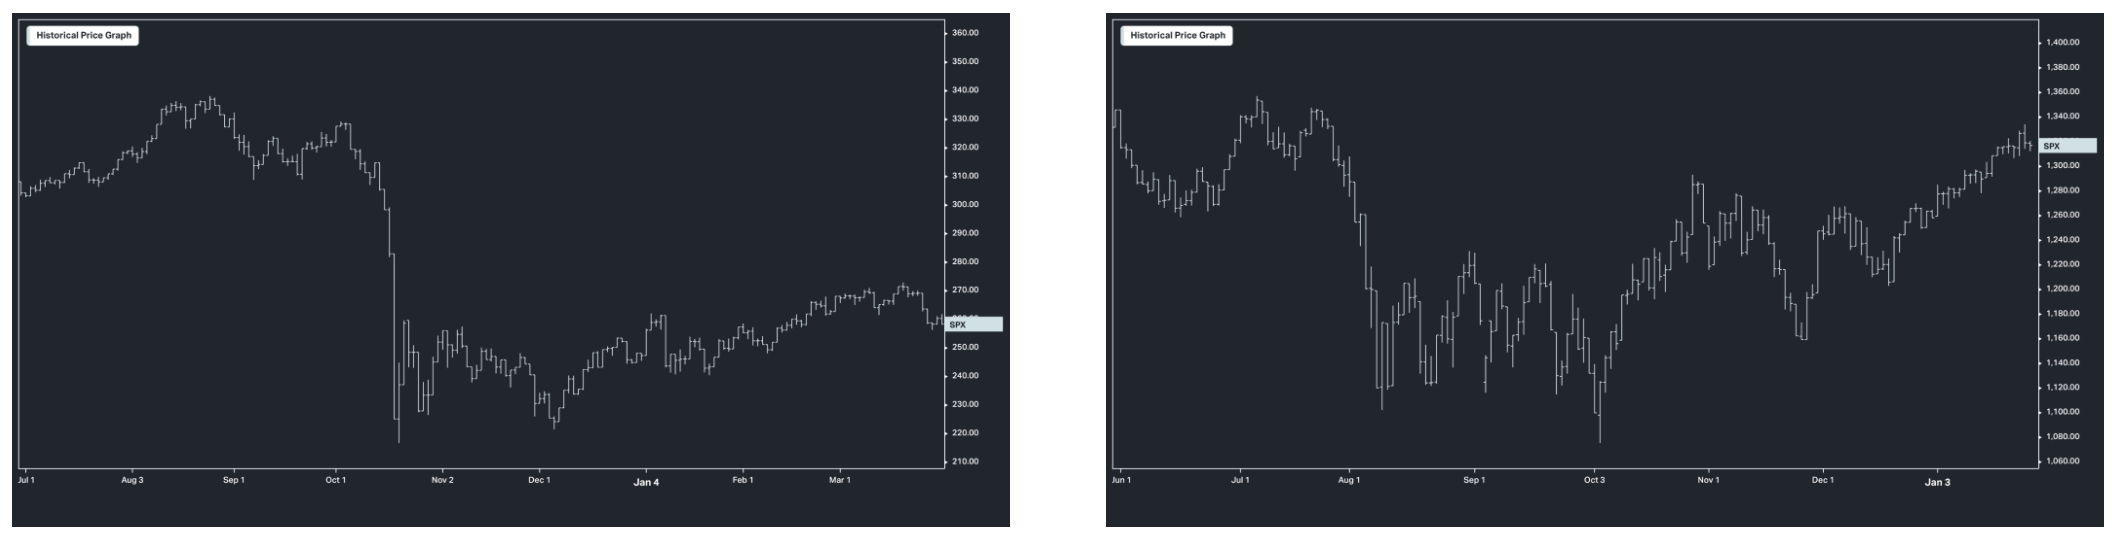
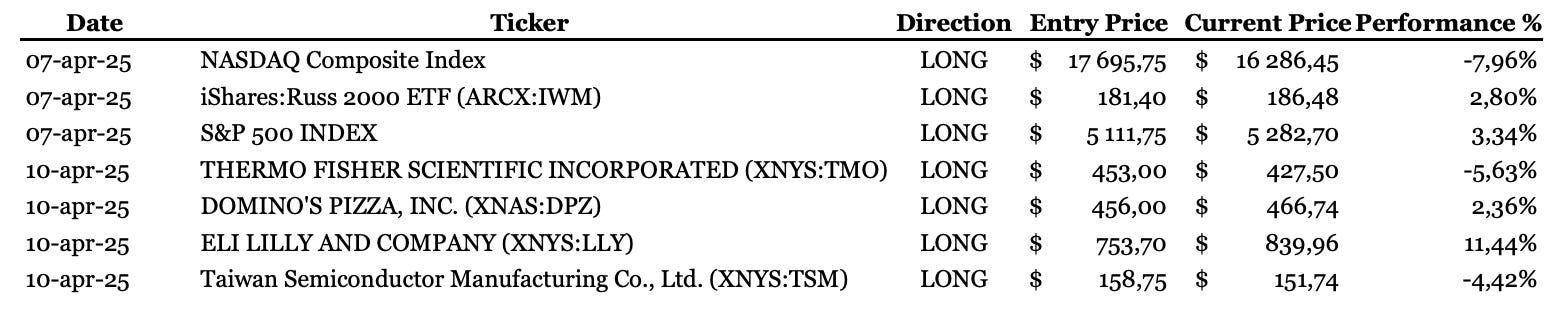
The “yoyo” post-crash pattern results from market participants’ sentiment oscillating wildly, as they take cues from each other. Typically, we see ~4-8 weeks of price oscillations (large initially, dampening over time) and there is often a re-test of the initial low at the end before a sustained rally can start. The below charts shows the 1Q2018 (left chart) crash and 2015 (right chart) crash, where the initial low is re-tested after 4-8 weeks.

Similar patterns, below, were also observed in larger market crashes like 1987 (left chart) and the 2011 (right chart) crash, where there was also a re-test of the initial low after 8 weeks.
In 2016 (left chart below), the re-test of the low happened very quickly. In 2010 (right chart below), after the May flash crash, the market did go on to make new lows as double-dip recession fears took over. The initial flash crash low was tested multiple times, but the final low was made about 8 weeks after the flash crash.

This post-crash pattern should be used as a guide rather than a foolproof map. The key takeaway is that the bottoming process usually plays out over a few weeks and investors should expect a high likelihood that the initial lows are re-tested.
There are a few examples of when this pattern did not work and it has usually been linked to major macro catalysts (GFC or Fed policy surprises).
In 2008 (left chart below), during the first part of the GFC crash, the 4-8 week pattern of dampening oscillations and a re-test was also observed, although subsequent macro developments resulted in new lows. This is probably not analogous to today, as readers of my daily notes will note we do NOT see the U.S. economy falling off a cliff. This view is further confirmed by our market trend model showing trend extensions to the downside—indicating the high likelihood of sideways to upside price developments.
In 2020, the historic intervention of the Fed helped to prevent a re-test of the initial lows, which is very rare historically. Again, this is probably not yet analogous to today.

In 4Q2018 (left chart below), Powell's comments that policy rates were a “long way” from neutral caused the equity market to crash at the start of October, while the December 2018 Fed meeting drove a further leg down to new lows as the Fed guided to multiple hikes in 2019 to address inflation. In April 2022 (right chart below), the Fed gave a clear indication that the market had uunderestimatedthe Fed's desire to hike rates, resulting in a lower low in equities.

In conclusion, the implication for today's investors is to look for dampening oscillations and a re-test of the initial lows (after 4-8 weeks) as clues that the medium-term bottom is in. The main catalyst that could invalidate this typical pattern would be a major policy surprise from the Fed.
Trade Idea’s: Recent Downside Trend Extensions – Presented without Comment
Access the Global Trend Report and add the Turning Points Study to your investment framework by clicking on the button below.


ps: If you know someone who may find the above of value, please share this post with them.