We are nearing the end of the year, with;
a negative return for stock investors.
a negative return for bond investors.
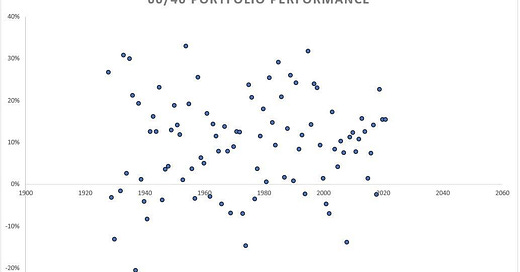
We looked at this chart below back in October, for perspective on how this year compares to history.
It has been an outlier year for the trusty 60% equity/40% bond portfolio. The only good news is that it has improved since October (when I made this chart) - now down 23%. It's no longer the worst year on record.
Let's take a look at how stocks have fared, historically, coming out of years that have shared the following two features: a negative 60/40 return, contributed to by a negative annual return for both stocks (s&p 500) and bonds (t bond).
It's a small universe. It happened four times, dating back to 1929.
1931. That was followed by a negative return year for stocks (down 9%) and a positive return year for bonds (up 9%).
1941. That was followed by a positive year for stocks (up 19%) and a positive year for bonds (up 2%).
1969. That was followed by a positive year for stocks (up 4%) and a positive year for bonds (up 16%).
2018. That was followed by a positive year for stocks (up 31%) and a positive year for bonds (up 10%).
The Gryning Portfolio - the Model Portfolio is used to set-up the foundations to capture the major, upcoming, market themes of 2023. Whilst the daily Dashboard narrow’s in on the equity allocation and guides you through the trade/investment cycle for each ticker.
I show closed positions for the Uncorrelated Convexity Portfolio below.
Institutional grade models give each ticker the once over before presenting you with an actionable trading strategy.


