The three major averages in the US erased early gains to trade sharply lower on Thursday, with the S&P 500 falling 1%, the Nasdaq losing about 1.5% and the Dow Jones sinking 500 points, after fresh data raised concerns about the health of the economy.
The ISM Manufacturing PMI pointed to a bigger-than-expected contraction in the manufacturing sector, the deepest in eight months and employment fell to 2020-lows.
The Fed hinted that a reduction in borrowing costs is close.
Meanwhile, Meta shares soared about 8%, as the company reported better-than-expected second quarter results and upbeat guidance.
Qualcomm on the other hand, was down about 5% after the company warned of trade-curb impact.
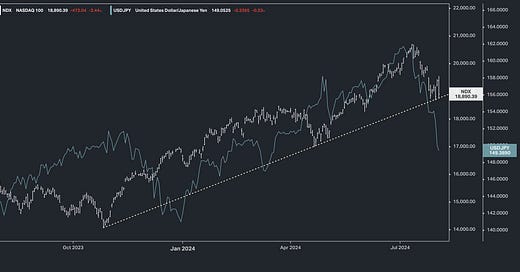
We’ve previously looked at a chart comparing USDJPY with the Nasdaq - the two have tracked closely, and it’s no coincidence.
This reflects the “carry trade” — the borrowing of yen for (effectively) free, converting that yen to dollars (dollar/yen goes up), and investing those dollars in the highest quality dollar-denominated assets (U.S. Treasuries and the big tech oligopoly stocks).
The rise in dollar/yen and rise in stocks are products of abundant global liquidity promoted by Bank of Japan monetary policy.
On that note, let’s revisit an excerpt from a previous note:
“With the Bank of Japan telegraphing the beginning-of-the-end of QE (a plan to taper global liquidity), the (carry) trade is reversing, as you can see within the white frame in the chart above.
And with that, the risk rises of global liquidity swinging in the direction of too tight (i.e. a liquidity shock). The question is, will the Fed surprise markets next week with a move, or will the market have to force the Fed’s hand?”
Fast forward to today: The Bank of Japan did indeed lay out the plan to reduce the size of the program that has supported the Japanese government bond market, and other key asset markets around the world (including U.S. Treasuries) for the past decade-plus. They also raise rates, and signalled more to come.
And the Fed did not surprise markets with a move (a counter-punch) but rather chose to hold rates unchanged (at historically high real rates) for the twelfth consecutive month.
With that dynamic at work, here is an updated look at this Nasdaq vs. dollar/yen chart …
As you can see to the far right of the chart, the reversal of the carry trade continues in dollar/yen and that suggests it will continue in the Nasdaq (in stocks).
That would mean a break of this big trendline we’ve been watching in the Nasdaq (and a similar line in the S&P futures).
As we discussed earlier this week, this trendline represents the trend from the October lows, which was marked by Fed signalling that the tightening cycle was over.
The trajectory of the trendline represents the view that financial conditions will be easing. But, again, the policy expectations that induced the trendline have not materialised.
So, back to the question in last week’s note: Will the market have to force the Fed’s hand?
It appears so.
If we get a weak jobs report, and if stocks break down, expect the Fed to line up the media tour for committee members to communicate certainty on a September cut.
Moreover, they should float the possibility of cutting by 50 basis points. Notably, in five of the past six rate cut series the Fed started with a half point cut.


and now that it was a weak number, how long before there are calls for an intermeeting cut?