


Weekly Market Signals
Performance of six trading strategies (more information); Tactical asset allocation, mean reversion, cross-sectional momentum, and equity long-short with weekly and monthly updating.
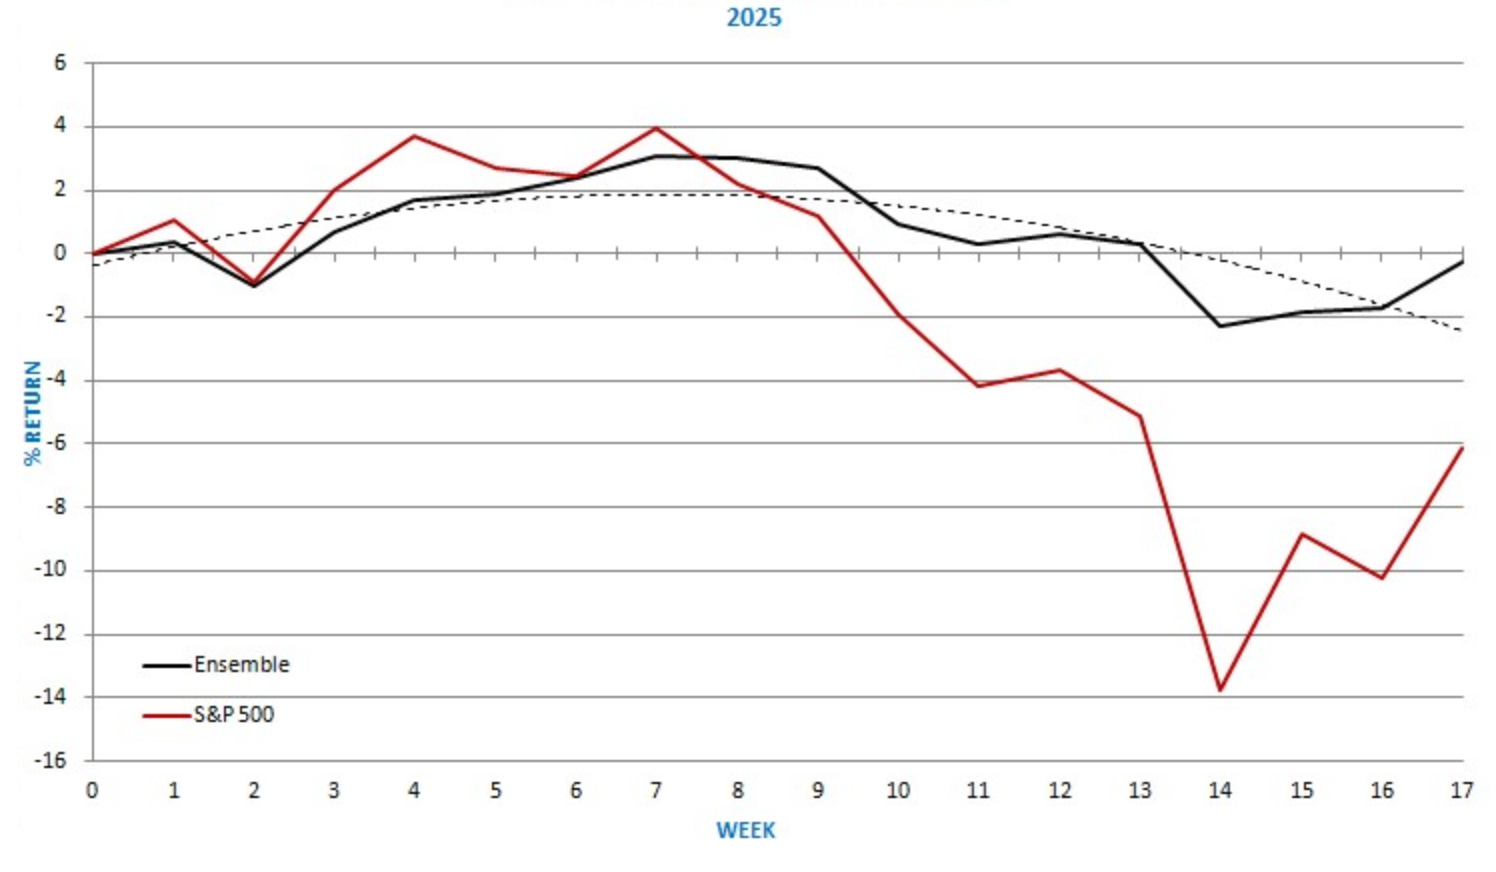
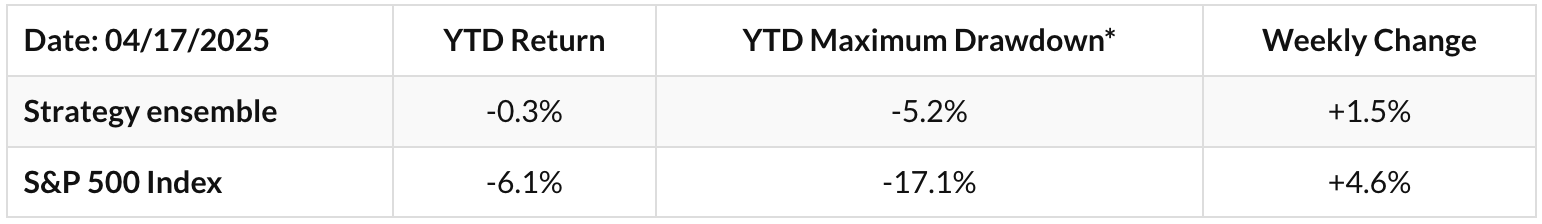
Performance of the six strategy ensemble and benchmarks
Comments
Last week, the ensemble gained 1.5% and continues to significantly outperform the S&P 500 index. Specifically, the ensemble is down 0.3% year-to-date, versus a loss of 6.1% for the S&P 500 index. On a weekly basis, the year-to-date maximum drawdown of the ensemble is 5.2%, versus 17.1% for the S&P 500 index.
The strategy ensemble has generated a new signal. So far this year, the objective of the ensemble has been met, which is higher risk-adjusted returns as compared to the benchmark.
This week’s report discusses the process of normalising the stock market, the performance statistics of the Magnificent 7 stocks, and a significant reversal in one of the most profitable pair trades. We also look at the current price trends in capital markets.

Daily Mean Reversion and the Futures Trend Following are two of the strategies that are available as part of the “One Solution, Multiple Benefits” ten (10) strategy rule pack (more information).
Daily Mean Reversion
The mean-reversion strategy uses our algorithm to generate long-only signals for two ETFs and now with S&P 100 stocks in the daily timeframe.
Daily Mean Reversion | Performance with SPY and QQQ (ytd)
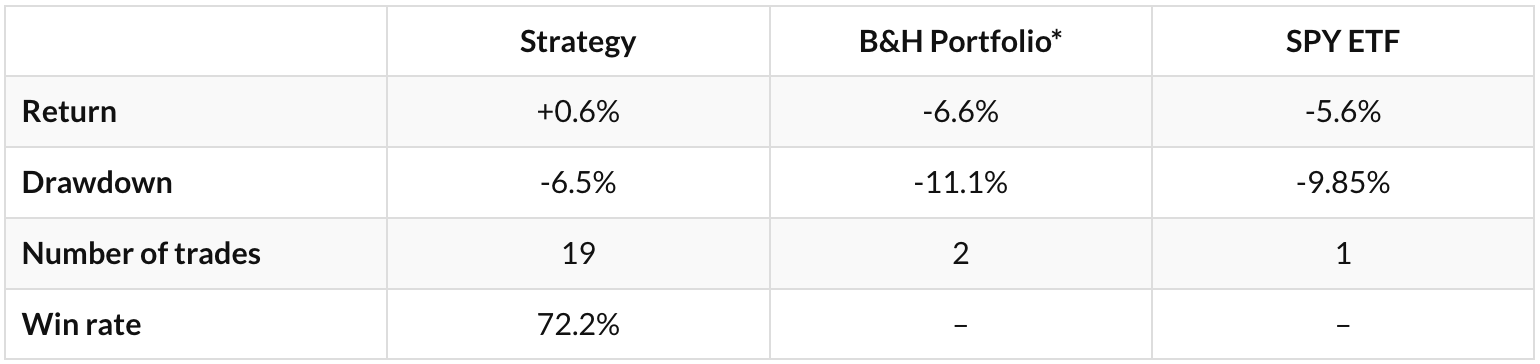
* 50% SPY ETF and 50% QQQ ETF
Historical Performance Ending 01/03/2000-12/31/2024
SPY and QQQ ETFs (50% allocation to each ETF, $0.01/share commission)

The following pairs can also be used in place of SPY and QQQ:
SSO and QLD for 2x leverage.
SPXL and TQQQ for 3x leverage.
ES and NQ futures.
Win rate is 69.1%, 1,389 trades, average holding period is 4.8 days, exposure is 41.4%. Performance is indicative only and depends on execution, slippage, and commissions.
SPY: The mean waiting time between signals has been 6.5 days, and 3 standard deviations are at 23.2 days.
QQQ: The mean waiting time between signals has been 4 days, and 3 standard deviations are 14.3 days.
Daily Mean Reversion | Performance with S&P 100 stocks since March 24, 2025

Members will find the Daily Equity Performance and Entry & Exit Signals in their inbox.
Summary Table | Ten Strategy Pack

Access the rules for the highlighted mean reversion strategy, alongside nine (9) other strategies listed in the table above, by clicking on the button below.
