


Weekly Market Signals
Performance of six trading strategies (more information); Tactical asset allocation, mean reversion, cross-sectional momentum, and equity long-short with weekly and monthly updating.
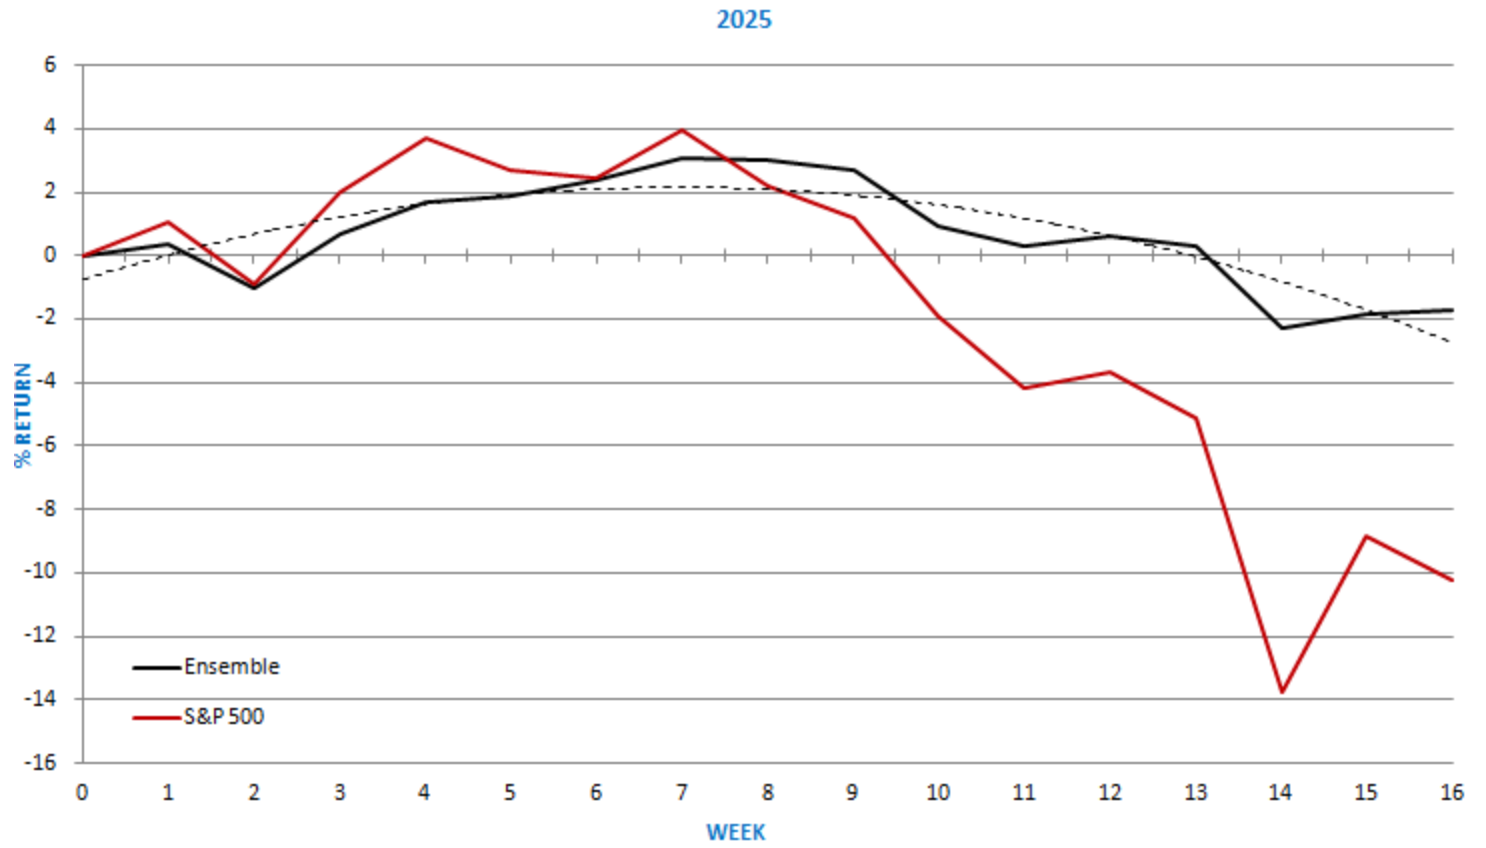
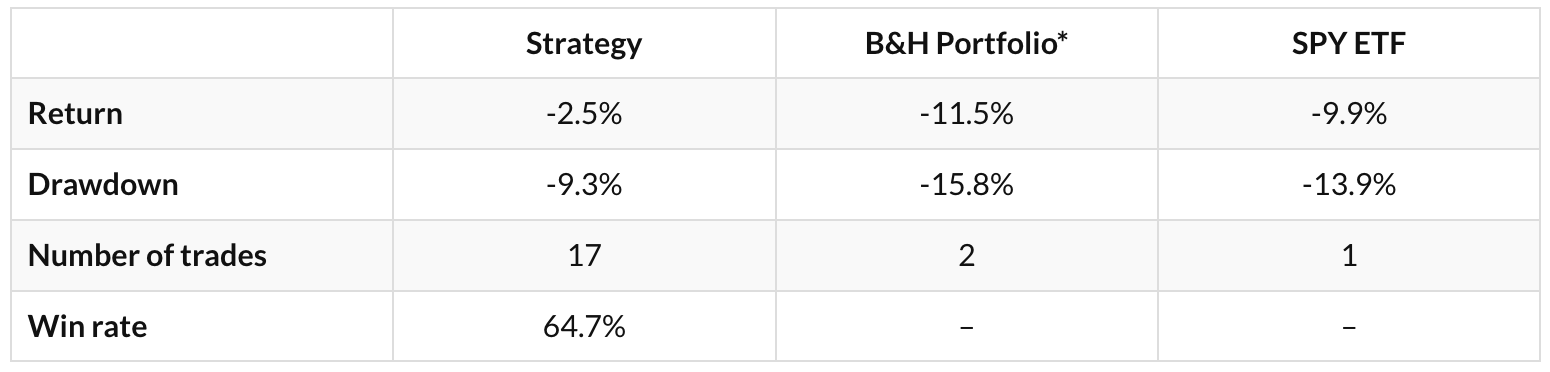
Performance of the six strategy ensemble and benchmarks

Comments
After two weeks with extreme price action, volatility decreased, but major stock market indexes ended the holiday-shortened week with losses.
This week’s net result saw the ensemble gain by a little over 0.1%, continuing to significantly outperform the S&P 500 index, which fell by 1.5%. Specifically, the ensemble is down 1.7% year-to-date, versus a loss of 10.2% for the S&P 500 index. On a weekly basis, the year-to-date maximum drawdown of the ensemble is 5.2%, versus 17.1% for the S&P 500 index. Therefore, the objective of the ensemble has been met, which is higher risk-adjusted returns. The 5-strategy ensemble (minus the Dow 30 long/short) is down 2.8% year-to-date.
Going forward, we expect an increase in volatility but not to the levels seen in the past three weeks.
Section 2 of the report discusses the odds of the stock market correction continuing based on the historical analysis of a popular indicator and the current hawkish position of the Fed. In Section 5, we look at the current price trends in capital markets. The strategy ensemble has generated a new signal. See Section 3 for details.

Daily Mean Reversion and the Futures Trend Following are two of the strategies that are available as part of the “One Solution, Multiple Benefits” ten (10) strategy rule pack (more information).
Daily Mean Reversion
The mean-reversion strategy uses our algorithm to generate long-only signals for two ETFs and now with S&P 100 stocks in the daily timeframe.
Daily Mean Reversion | Performance with SPY and QQQ (ytd)
* 50% SPY ETF and 50% QQQ ETF
Historical Performance Ending 01/03/2000-12/31/2024
SPY and QQQ ETFs (50% allocation to each ETF, $0.01/share commission)

The following pairs can also be used in place of SPY and QQQ:
SSO and QLD for 2x leverage.
SPXL and TQQQ for 3x leverage.
ES and NQ futures.
Win rate is 69.1%, 1,389 trades, average holding period is 4.8 days, exposure is 41.4%. Performance is indicative only and depends on execution, slippage, and commissions.
SPY: The mean waiting time between signals has been 6.5 days, and 3 standard deviations are at 23.2 days.
QQQ: The mean waiting time between signals has been 4 days, and 3 standard deviations are 14.3 days.
Daily Mean Reversion | Performance with S&P 100 stocks since March 24, 2025

Members will find the Daily Equity Performance and Entry and Exit Signals in their inbox.
Summary Table | Ten Strategy Pack

Access the rules for the highlighted mean reversion strategy, alongside nine (9) other strategies listed in the table above, by clicking on the button below.

NDM and NDMVix are machine learning algorithms (statistical models) based on alternative data – dark pool data and options dealer gamma exposure (DIX, GEX and VIX Futures) – with the goal to predict the direction of the next day move in the S&P 500 index; futures or ETF’s.
Membership to the Next Day Models has reached our initial desired limit - the models will now be available at an increased price of £600/year. As this update is being sent out on Easter Monday, we have extended an offer should any readers wish to access the model before the price rise.
This offer will expire on Tuesday, April 22, 2025, at midnight.
