


Weekly Market Signals
Performance of six trading strategies (more information); Tactical asset allocation, mean reversion, cross-sectional momentum, and equity long-short with weekly and monthly updating.
Performance of the six strategy ensemble and benchmarks


Comments
A rare two-day 7-sigma event occurred in the market, with the S&P 500 plummeting 10.5% in the last two days of the week due to the announcement of massive tariffs.
Tactical asset allocation was up 0.5% due to closing the SPY ETF position on the opening day of this month. Dow-30 long/short performed as expected and provided a much-needed hedge of 2.9% for the week. The ensemble fell 2.5% versus a drop of 9.1% for the S&P 500 index. Both the current market action and a macro perspective justify the two new signals generated by cross-sectional ETF momentum.
Although the ensemble is outperforming the benchmark by a wide margin year-to-date, this is no reason to celebrate. Market uncertainty is bound to increase due to a new geopolitical, economic, and financial regime.

Daily Mean Reversion and the Futures Trend Following are two of the strategies that are available as part of the “One Solution, Multiple Benefits” ten (10) strategy rule pack (more information).
Daily Mean Reversion
The mean-reversion strategy uses our algorithm to generate long-only signals for two ETFs and now with S&P 100 stocks in the daily timeframe.
Daily Mean Reversion | Performance with SPY and QQQ

Historical Performance Ending 01/03/2000-12/31/2024
SPY and QQQ ETFs (50% allocation to each ETF, $0.01/share commission)

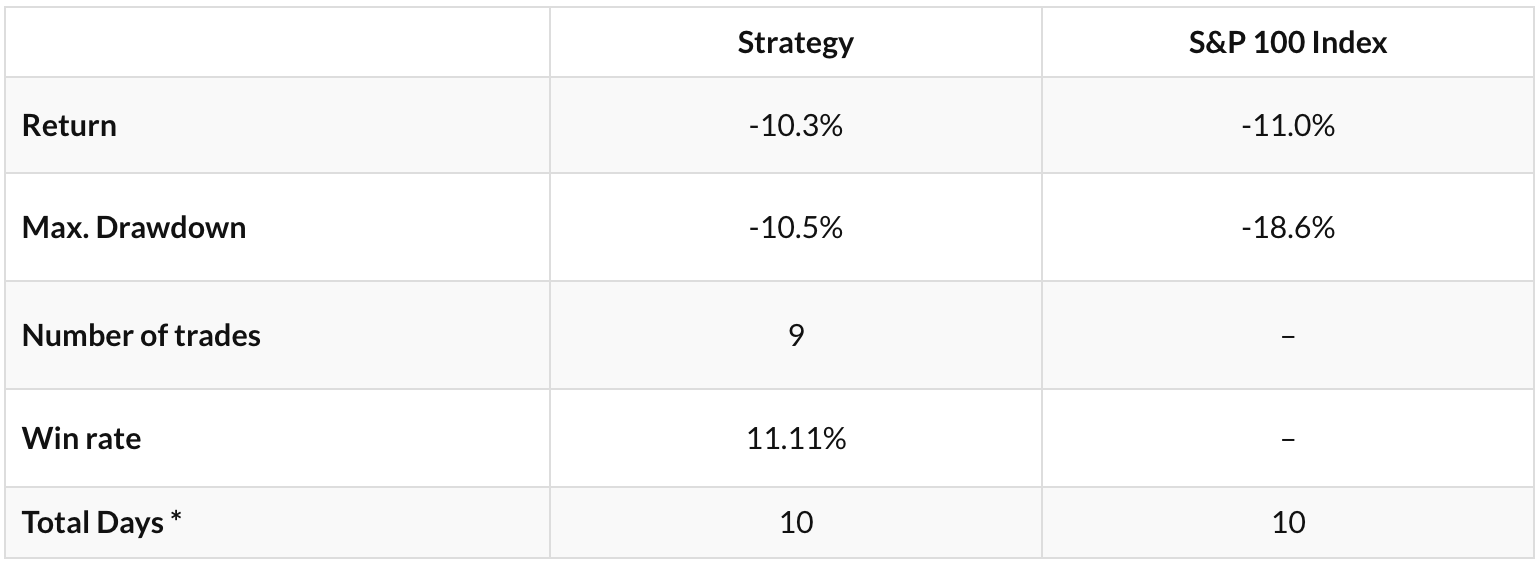
Daily Mean Reversion | Performance with S&P 100 stocks since March 24, 2025
Historical Performance for stocks: 01/03/2000-03/21/2025

The following pairs can also be used in place of SPY and QQQ:
SSO and QLD for 2x leverage.
SPXL and TQQQ for 3x leverage.
ES and NQ futures.
Win rate is 69.1%, 1,389 trades, average holding period is 4.8 days, exposure is 41.4%. Performance is indicative only and depends on execution, slippage, and commissions.
SPY: The mean waiting time between signals has been 6.5 days, and 3 standard deviations are at 23.2 days.
QQQ: The mean waiting time between signals has been 4 days, and 3 standard deviations are 14.3 days.
Updated (weekly) after the close of Friday, April 4, 2025 (backtest)
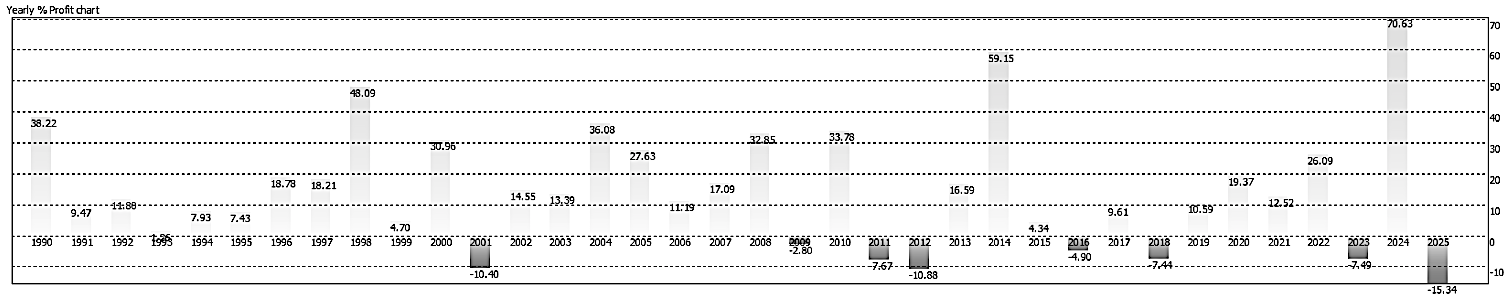
The strategy is down 15.3% year-to-date.
The drawdown from equity highs is 19.5%.
There are 9 open positions, 6 long and 3 short.
Details of the strategy used:
Timeframe: Daily
Strategy Type: trend-following based on breakouts, exit long, and reverse to short with stop-loss.
Maximum positions: 23, long or short.
Position size: Based on stop-loss and maximum risk per position.
Trade entry: All trades are executed at the opening of the next bar.
Stop-losses: All stop-losses are executed intraday.
Summary Table | Ten Strategy Pack

If you would like to purchase the rules of the Ten Strategy Pack, click on the button below.

Next Day Model
NDM and NDMVix are machine learning algorithms (statistical models) based on alternative data – dark pool data and options dealer gamma exposure (DIX, GEX and VIX Futures) – with the goal to predict the direction of the next day move in the S&P 500 index, futures or ETF’s.
The final result produces a score that indicates a bullish or bearish leaning stance (+ve/-ve score) for the subsequent trading day, along with simulated return statistics (backtest) for a few historical time periods.

Subscribers receive a daily NDM prediction, along with underlying DIX/GEX data, and various statistics. The update is published everyday around 07:00 GMT, to allow for futures trading during European market hours.
