


Weekly Market Signals
Performance of six trading strategies (more information); Tactical asset allocation, mean reversion, cross-sectional momentum, and equity long-short with weekly and monthly updating.
Performance of the six strategy ensemble and benchmarks


The ensemble turnover remains low, as three strategies do not have any positions. ETF cross-sectional momentum gained about 1% for the week, while sector cross-sectional dynamic momentum ended the week with a loss of less than 0.1%.
We like to remind our readers that our reports are transparent about signals and positions, and there is no ambiguity, although there may be differences in performance calculations due to slippage and other trading friction effects. We report all entries and exits in advance for the first trading day of the following week or month. We do not make vague claims about entries and exits depending on whether the price action was favourable or not. We do not try to guess the market; we follow strategies. Trying to guess the market may offer high short-term gains occasionally, but the long-term expectation is negative, and experienced market professionals know this well.
Hybrid asset allocation (HAA) employs two strategies: asset cross-sectional momentum and strategic allocation. Both strategies use ETFs to generate signals.
The asset cross-sectional momentum strategy (CSMOM) and the strategic allocation strategy (MOMMF) generate signals in the monthly timeframe. The MOMMF incorporates both tactical and passive elements and undergoes annual rebalancing.

The table below shows the performance metrics of HAA since 2020, the total return for HAA is 78.6%, and for SPY ETF, it is 86.4%. Below is a performance comparison table from January 2020 to April 2025 (in the monthly timeframe).

The Sharpe ratio of HAA is 1.94x that of a buy-and-hold SPY ETF. The maximum drawdown of HAA is 25% of the buy-and-hold SPY ETF’s drawdown. HAA’s annualised return is lower by 90 basis points compared to buy and hold, but there is a significant improvement in risk-adjusted returns and potential for leveraged alpha.

Daily Mean Reversion is one of the strategies that is available as part of the “One Solution, Multiple Benefits” ten (10) strategy rule pack (more information).
Daily Mean Reversion
The mean-reversion strategy uses our algorithm to generate long-only signals for two ETFs and now with S&P 100 stocks in the daily timeframe. The updates are typically available by 7:00 a.m. (ET) on weekdays.
Daily Mean Reversion | Performance with SPY and QQQ (ytd)

* 50% SPY ETF and 50% QQQ ETF
Historical Performance Ending 01/03/2000-12/31/2024
SPY and QQQ ETFs (50% allocation to each ETF, $0.01/share commission)

The following pairs can also be used in place of SPY and QQQ:
SSO and QLD for 2x leverage.
SPXL and TQQQ for 3x leverage.
ES and NQ futures.
Win rate is 69.1%, 1,389 trades, average holding period is 4.8 days, exposure is 41.4%. Performance is indicative only and depends on execution, slippage, and commissions.
SPY: The mean waiting time between signals has been 6.5 days, and 3 standard deviations are at 23.2 days.
QQQ: The mean waiting time between signals has been 4 days, and 3 standard deviations are 14.3 days.
Daily Mean Reversion | Performance with S&P 100 stocks since March 24, 2025

Summary Table | Ten Strategy Pack
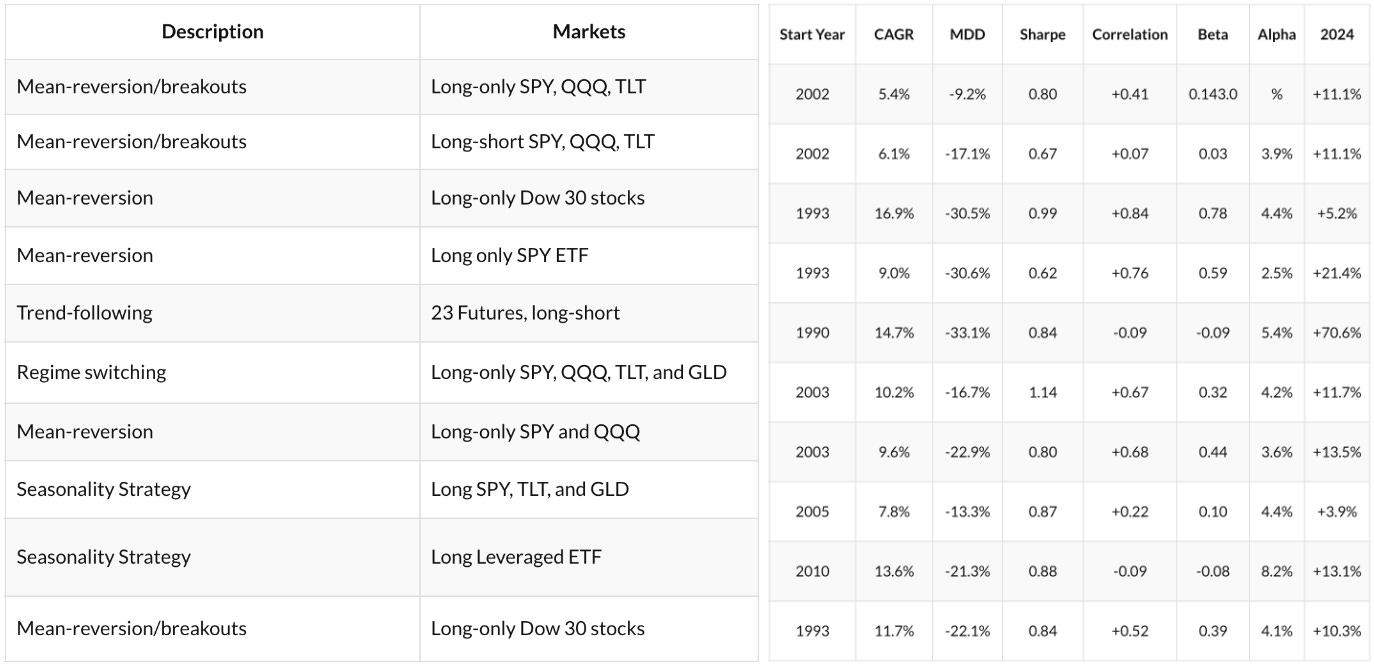
The strategies we have developed are based on the following two principles: simplicity and economic value.
Simplicity reduces the probability of overfitting and data-mining bias. Economic value is necessary in the form of reasonable alpha and risk-adjusted returns.
The strategies are suitable for traders with basic knowledge of programming and testing rules on backtesting platforms. We provide the rules only. We do not provide any code.
