


Weekly Market Signals
Performance of six trading strategies; Tactical asset allocation, mean reversion, cross-sectional momentum, and equity long-short with weekly and monthly updating.
Performance of the six strategy ensemble and benchmarks

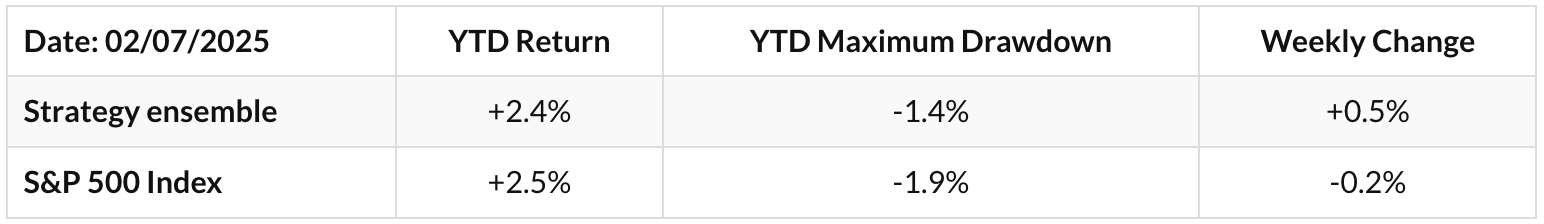
The weekly strategy ensemble has outperformed SPX for two weeks in a row. In 2024, the strategy ensemble gained 12% with a 3.4% maximum drawdown. The four asset allocation models are updated on a monthly basis.
Dynamic Momentum strategy: 2024 return 24.9%, maximum drawdown -4%
Hybrid Asset Allocaion strategy: 2024 return 16.7%, maximum drawdown -2.1%
For a limited time and for a limited readership (10 members in total), all Gryning strategies and information content is available for a hugely discounted price with four years of strategy & information content (more information).

Next Day Model
NDM and NDMVix are machine learning algorithms (statistical models) based on alternative data – dark pool data and options dealer gamma exposure (DIX, GEX and VIX Futures) – with the goal to predict the direction of the next day move in the S&P 500 index (SPX).

Why Now?
We’re entering one of the most pivotal decades in financial history. The old system is crumbling. The new one is forming. Let’s not be caught off guard and instead use this crisis to build generational wealth.

Daily Mean Reversion and the Futures Trend Following are two of the strategies that are available as part of the “One Solution, Multiple Benefits” 10 strategy rule pack.
Daily Mean Reversion
Daily Mean Reversion | Performance with SPY and QQQ

The following pairs can also be used in place of SPY and QQQ:
SSO and QLD for 2x leverage.
SPXL and TQQQ for 3x leverage.
Performance with SPXL and TQQQ

* Start date: June 27, 2023. The allocation to the signals of the two ETFs is 50% of closed equity. Performance is indicative only and depends on execution, slippage, and commissions.
Historical Performance Ending 01/03/2000-12/31/2024
SPY and QQQ ETFs (50% allocation to each ETF, $0.01/share commission)

Win rate is 69.1%, 1,389 trades, average holding period is 4.8 days, exposure is 41.4%. Performance is indicative only and depends on execution, slippage, and commissions.
SPY: The mean waiting time between signals has been 6.5 days, and 3-standard deviations are at 23.2 days.
QQQ: The mean waiting time between signals has been 4 days, and the three-standard deviations are 14.3 days.
Futures Trend Following
Update after the close of Friday, February 07, 2025 (backtest):
The strategy is down 1.6% year-to-date.
The drawdown from equity highs is 6.4%.
There are 13 open positions, 12 long and 1 short.

Summary Table | Ten Strategy Pack

Imagine this: Six months from now, you’re no longer second-guessing your trades or reacting emotionally to market swings. Instead, you’re executing with precision—backed by systems that work and a community that supports your growth every step of the way.
You’ve built a trading business that doesn’t rely on guesswork—a business grounded in discipline and adaptability. If you’re ready to think differently, invest wisely, and profit immensely, join us.
Questions & group discounts: aaj.tgt@protonmail.com
