Market recap, open positions, new signals, and performance of six trading strategies. Tactical asset allocation, mean reversion, cross-sectional momentum, and equity long-short with weekly and monthly updating. Access the full report with a GRYNING | Quantitative membership.
Performance of the ensemble and benchmarks
Weekly return of the ensemble: -0.0%
This week, the equity of the equally weighted strategy ensemble was flat near new highs for the year.
Year-to-date performance (Backtest, no leverage)
On a risk-adjusted basis, the ensemble outperforms both the SPY ETF and its equal-weight counterpart, the RSP ETF. At 2x leverage, the strategy ensemble outperforms the S&P 500 total return this year on both an absolute and risk-adjusted basis.
Recap and market outlook (November 29–December 6, 2024)
The strategy ensemble finished the week flat. This week, systematic trading faced elevated risks, but diversification prevented a significant loss. Although the large-cap index (SPY) gained 0.9%, conditions in the broader market deteriorated, with the S&P 500 equal-weight ETF (RSP) ending the week down 1.3%. Utilities (XLU) and S&P 500 low volatility stocks (SPLV) fell this week 3.9% and 2.4%, respectively. Anyone with a slight idea of what is happening in this market knows that this year’s performance is primarily due to a concentrated boost by a few technology stocks.
Fundamental factors had a small impact on the market’s rise this year. On average, the seven significant stocks gained 6.3% for the week and are up 63.4% for the year. The cap-weighted S&P 500 index (SPY) has reached new all-time highs with a 29.1% year-to-date return, thanks to financial engineering, excessive deficit spending, artificial intelligence developments, and related narratives. However, the equal-weight S&P 500 index is up 18.8% year-to-date.
In this environment, as experience shows, you only hear the winners bragging, but there are losers who remain silent. We believe the ensemble performed well this year. We are never satisfied with any level of performance. However, we have to be realistic. Our objective with this ensemble is reasonable risk-adjusted returns over the years. This ensemble cannot achieve a hundred percent return per year, which is what bitcoin has delivered this year. However, large returns are the outcome of significant risk and potentially large losses in the future. Large short-term gains usually lead to long-term losses, while small short-term gains often translate to long-term gains.
For positions, strategy performance, and signal summary for next week, click on the button below.
What’s Driving the Bitcoin Rally?
Despite lower returns since its inception, the crypto coin’s price has more than doubled this year. The momentum is due to a combination of politics and marketing that feed cognitive biases. This is the recipe for a bubble market.
On January 1, 2024, the price of bitcoin was approximately $44,200, which was 34% lower than its peak in October 2021. By September of this year, the price was about $60,000. At that point, it became clear that a political shift would favour cryptocurrencies, or at least assert its support for them. Then, the rally toward $100,000 began.
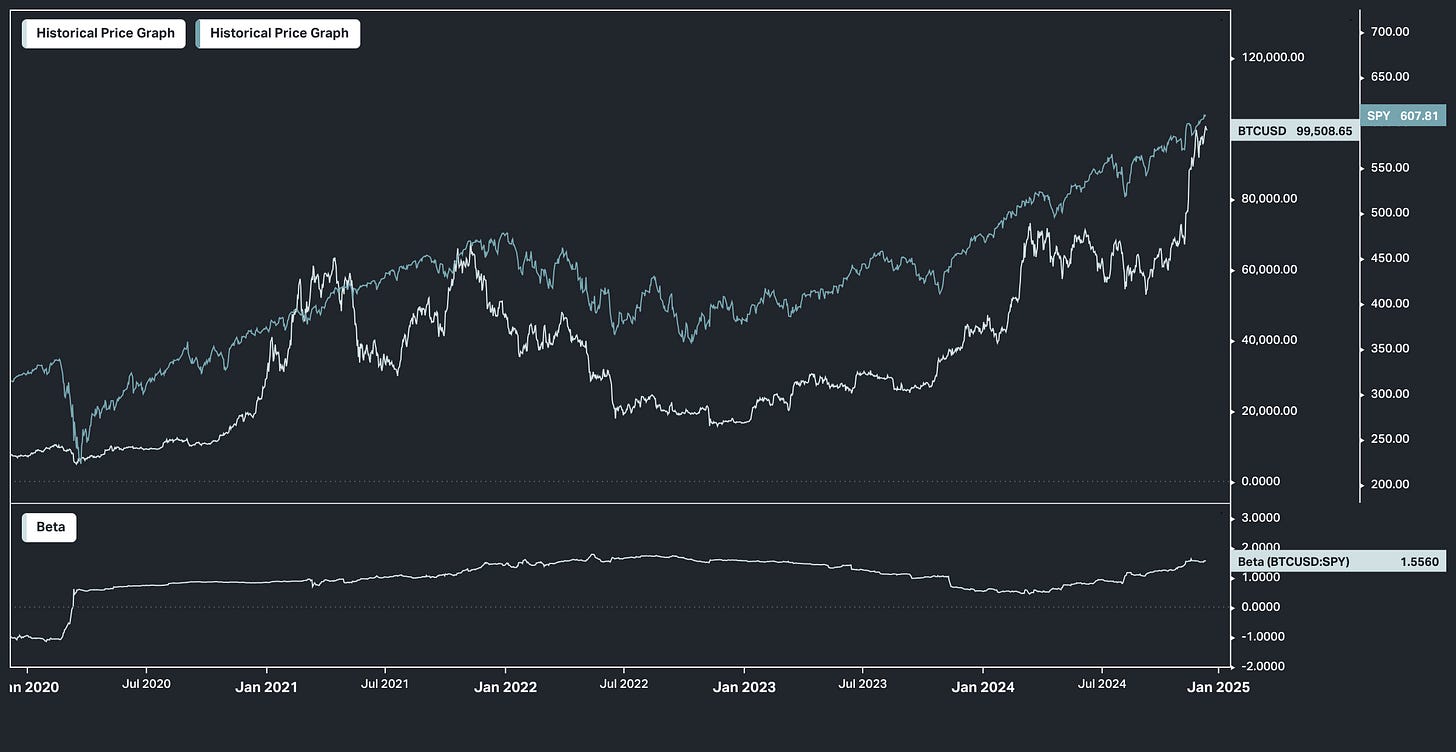
However, one of the many issues with bitcoin is its strong correlation with the stock market.
Bitcoin and S&P 500 E-mini futures have had a positive correlation since 2020, which by the end of 2022 reached a high. This indicates that bitcoin does not contribute positively to a diversified portfolio and may potentially negatively impact performance in bear markets. Will this positive correlation change in the future? We believe such a regime change has low odds.
More importantly, yearly bitcoin returns have decreased parabolically over the years.
Those who invest $10,000 in bitcoin with the hope of becoming millionaires soon should review the above chart. Large returns belong to the past and are unlikely to occur again. While it is possible to achieve returns in the range of 1000%, it is not a realistic expectation.
Politics and past performance have given rise to a few cognitive biases that are driving bitcoin higher.
Status quo cognitive bias: The future will continue to reflect the past.
The conservatism bias refers to the slow change of beliefs in response to new evidence.
Endowment cognitive bias: People value bitcoin more because they own it.
Optimism cognitive bias: Desires and expectations influence bitcoin’s price.
As long as politics and marketing feed the cognitive biases, bitcoin’s price could increase. However, a bear market has high odds. Furthermore, a declaration of cryptocurrencies as illegal instruments could potentially trigger a left-tail event and an absorbing barrier (total loss).
I want to thank you for being a loyal reader of my daily Macro Perspectives notes.
Your trust and support drive me to deliver the insights and opportunities that (I hope) you won't find anywhere else. I ask you to consider becoming a member of either our Quantitative or Research services, built for individuals who want to hit the ground running by leveraging the power of machine learning to access reproducible, robust, interpretable and easy to use signals and reports.


