


Market Signals for December 02, 2024


Market recap, open positions, new signals, and performance of six trading strategies. Tactical asset allocation, mean reversion, cross-sectional momentum, and equity long-short with weekly and monthly updating. Access the full report with a GRYNING | Quantitative membership.
Performance of the ensemble and benchmarks
Weekly return of the ensemble: +0.7%
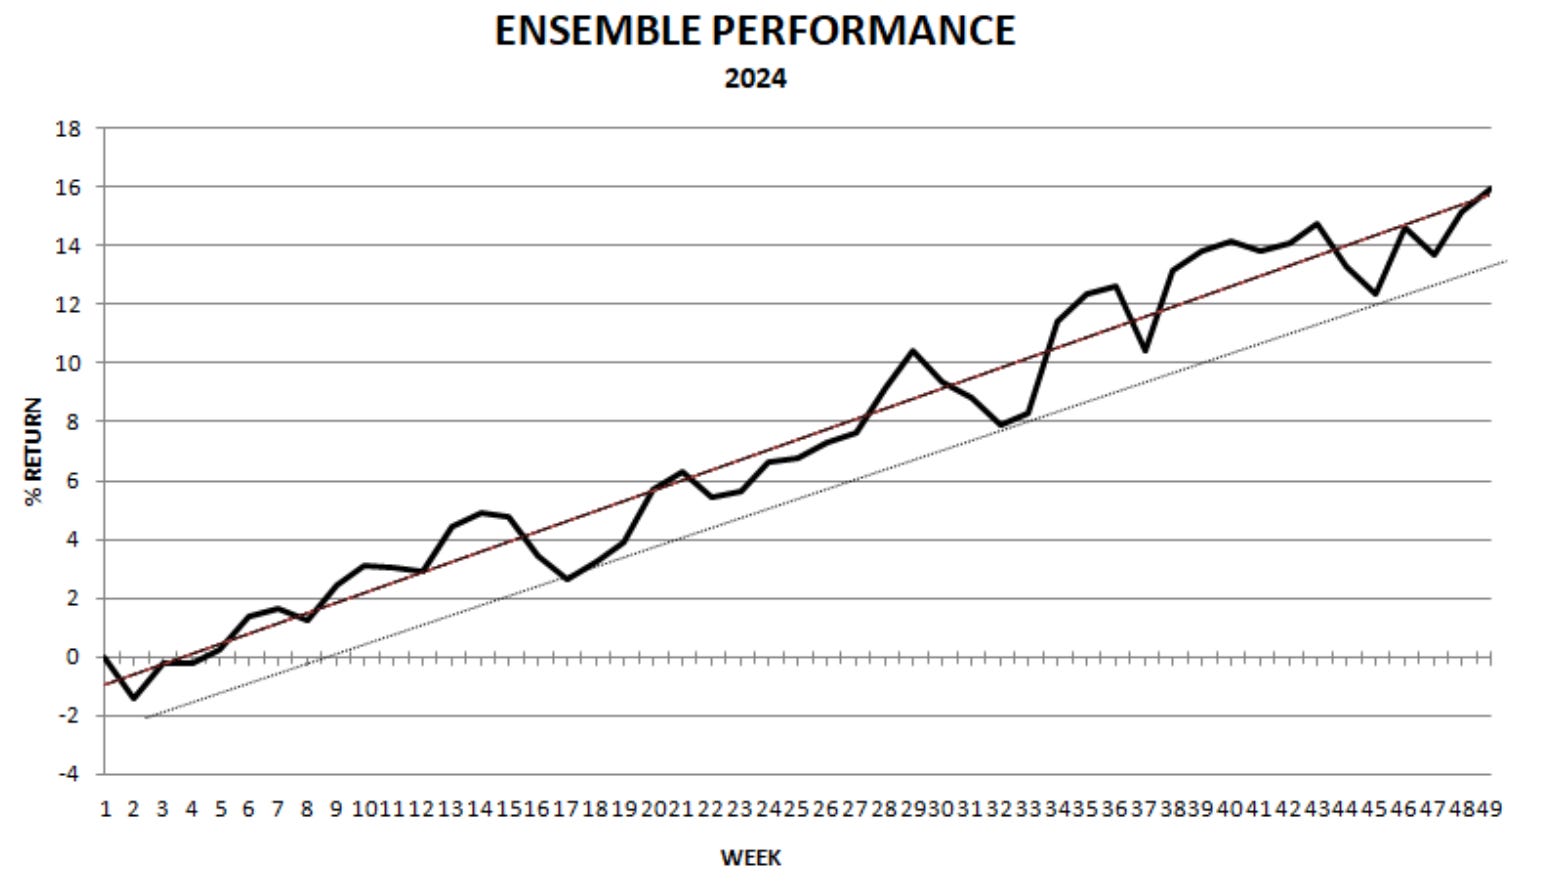
Last week, the equity of the equally weighted strategy ensemble gained 0.7% to new highs for the year. On a risk-adjusted basis, the ensemble outperforms both the SPY ETF and its equal-weight counterpart, the RSP ETF. At 2x leverage, the strategy ensemble outperforms the S&P 500 total return this year on both an absolute and risk-adjusted basis.

Recap and market outlook (November 25–November 29, 2024)
In the holiday-shortened week, stocks (SPY) gained 1.2%, and bonds (TLT) rallied 4%. Commodities (DBC) and the US dollar (UUP) fell 1.9% and 1.6%, respectively.
The strategy ensemble ended the week with a gain of 0.7%, mainly due to a rebound in the performance of tactical asset allocation (SB) and solid performance from sector cross-sectional momentum (SR).
Systematic traders rarely fall into the cognitive dissonance trap of trying to rationalise market price action. Although the TLT ETF surged 4% in the last week, pretending to comprehend the reasons for the move is probably due to cognitive biases and delusions rather than sound analysis. While some analysts are more skilled than others and may have mastered this art and science, the expectation from attempting to understand a highly non-linear system ultimately converges to zero, even in the best-case scenario.
Frequency of Large Gains in TLT
Since 2022, large daily gains of more than 2.5% in TLT ETF have been more frequent. In addition, these large daily gains have not provided a signal of a market bottom.
On Monday, November 25, 2024, the TLT ETF rallied 2.5%. Some technical analysis interpreted the move as a signal of the end of the bear market in long-duration bonds. However, as we demonstrate below, the frequency of large daily gains of more than 2.5% has been higher in the current bear market than before.
The histogram below shows that there have been 48 daily returns larger than 2.5% since the inception of the TLT ETF.

Also, since 2022, there have been 9 such large returns. Therefore, from 2002 to 2021, the frequency of these large returns was about 2.05/year, but after 2021 it has been 3/year, although the TLT ETF has been in a bear market.
A bottom does not require large daily returns; during downtrends, those are usually “reflex” or “short covering rallies.” This is true in all markets, including the TLT ETF.

Systematic trading treats gains and losses the same way: they are part of the game, and as long as the expectation remains positive and the risk-adjusted returns are reasonable, then leverage might provide compounding over the years. This is the objective of the weekly market signals. At 2x leverage, the strategy ensemble outperforms the S&P 500 total return this year on both an absolute and risk-adjusted basis.

As an introductory offer, we are currently accepting teams of up to 3 members for the price of a single membership.