Looking For a Problem
US equities finished in the red on Friday, with the S&P 500 closing 0.1% lower, below its all-time high of 5,374.
The Nasdaq retreated by 0.2% and Dow Jones lost 87 points, after the robust jobs report alleviated concerns about an economic slowdown even though this might result in a possible postponement of Federal Reserve rate cuts.
The odds for a Fed easing in September fell sharply to 55% from 68% before the report.
Financial, Industrial and tech sectors were leading the gains while real estate, materials, and utilities were the worst performers.
Among megacap stocks, Microsoft, Nvidia, and Meta each lost 0.1%, Amazon declined by 0.3%, and Alphabet dropped by 1.3%, while Apple rose by 1.5%.
Once again, the stock market has defied expectations.
Although analysts significantly reduced their estimated probability for recession this year, it has been widely assumed that this election year would be volatile and there was not much room for the “expensive” stock market to become even more expensive.
The most bullish Wall Street S&P 500 end of year estimates call for about 3% upside from its current level. Bearish analysts believe the S&P 500 may end the year down 20%.
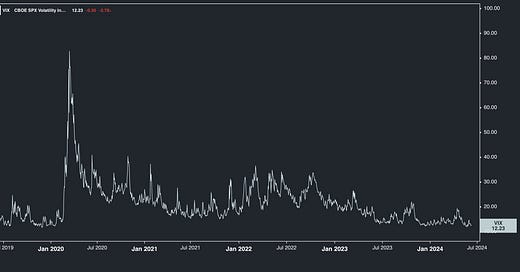
The S&P 500 is up 12.5% year-to-date and at an all-time high. The NASDAQ Composite Index is at an all-time high. The volatility index (VIX) is near 5-year lows.
When the mindset is biased towards the negative, analysts have been eager to find fundamental evidence that supports a tilted negative narrative;
The ISM Manufacturing Index indicates contraction and was reported below expectations this week. Both new orders and the backlog of orders indexes declined.
Cyclical stocks have been underperforming the overall S&P 500 which may be an early sign of recession.
There has been an uptick in consumer loan delinquencies caused partly by high inflation, gas prices and interest rates.
The Conference Board’s Consumer Confidence index in April fell to its lowest level in two years.
There have been declines in real personal consumption expenditures growth and real private fixed investment growth.
Home sales are declining.
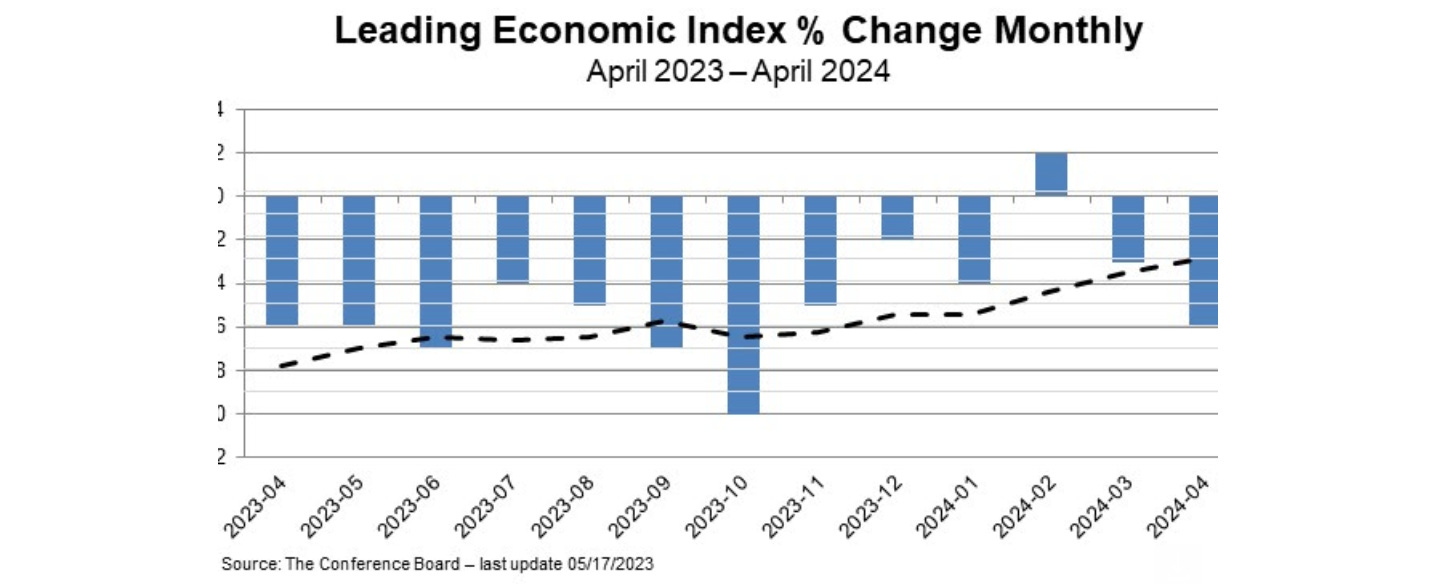
When the above data points are overlaid on an investment environment whereby the yield curve has been inverted for two years and the Leading Economic Index (LEI) is persistently negative, an investor may assume a recession is finally beginning to make an appearance.
But the data and market continue to defy expectations;
The ISM Non-Manufacturing (Services) Index increased to 53.8% in May, ahead of expectations and up from 49.4% in April. The prices component of the index declined from 59.2% to 59.1%. The service section comprises roughly 78% of U.S. GDP.
The 10-year treasury rate pulled back from about 4.6% to 4.3% in June on less inflationary data points. Better economic growth and lower interest rates are constructive for stock valuations.
The new wild-card positive is the impact of Artificial Intelligence (AI) on U.S. economic performance. Analysts are revising higher their profit margins for the S&P 500 companies much as a result of AI efficiencies (lower labor costs) which leads to faster than expected profit growth.
PS: I am due to present a “Practical Frameworks for Financial Markets” 3 day course and will make the material available to those of you interested in bridging the gap between theory and real world. This self-paced course will equip you with a set of robust and practical frameworks that combine logic, stories, data and more to help you see markets more clearly, make better forecasts, and make more money.
What you’ll learn
History, cycles and mega trends
Narratives, bubbles and crashes
Economic data and central banks
Market psychology
For more information and to register your interest, please send me an email at a.karlsson@gryningcapital.com


