The July inflation report did indeed break the streak of twelve consecutive months of declining year-over-year U.S. inflation.
At 3.2%, it's about a third of where it was a year ago - still some distance from the Fed's obsessed about 2% target, whilst the core rate (excluding food and energy) is still in the high 4s.
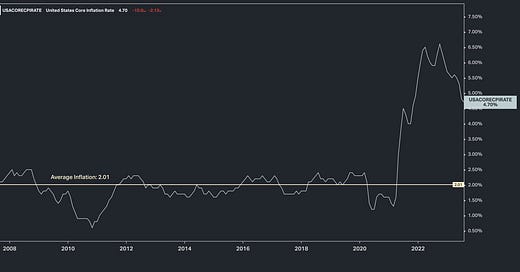
But let's revisit a chart that suggests the Fed should be feeling pretty good about the current level of inflation.
Relating to the above chart, it's important to remember that the Fed made an official policy change in the way they evaluate their 2% inflation target back in September of 2020.
Inflation had been too low, for too long. For the better part of the prior decade, inflation ran well below their two percent target. So, Jay and company told us explicitly that they would let inflation run hot, to bring inflation back to 2% on average, over time.
They've done just that. The above is the chart on the Fed's favored inflation gauge, core PCE - they countered thirteen years of weak inflation, with two years of hot inflation, for an average of 2%.


Too low for whom? 😂