The inflation data came in hot on Friday, as we suspected.
Here's what it looks like with some historical perspective...
This is early 80s-level inflation - the last time we had this degree of inflation, the effective Fed Funds rate (the rate the Fed sets) was 14.45%. Today it's 0.08%.
What was the Fed Funds rate when inflation peaked in 1980 at nearly 15%? 17.6%.
What about the spike in 1974-1975? Inflation started to come under control, only after the Fed ratcheted rates up above the level of inflation. In late summer of '74, inflation was running 11.5%, the Fed took rates up to 13%.
So, with the Fed currently at zero and inflation running at (least) 6.8%, this is going to be a painful battle. The Fed is way, way behind - double-digit inflation continues to look like the most probable scenario.
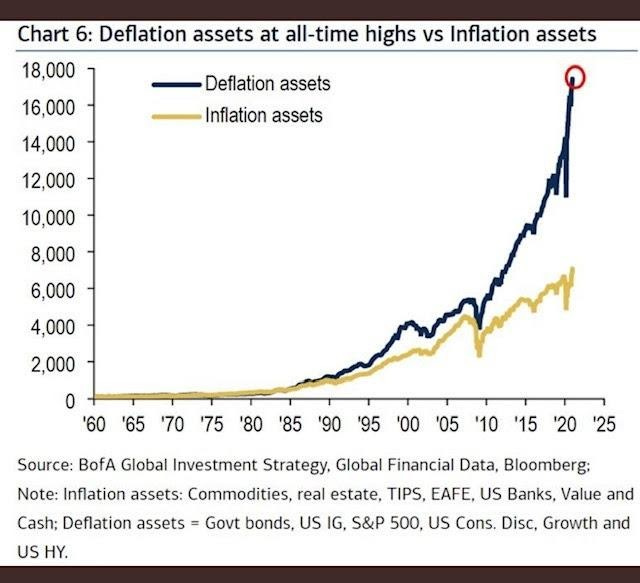
With this in mind, I want to copy in an excerpt from my note back in March, where we looked at this chart from Bank of America, which gives us a visual on the record extreme divergence in the performance of deflationary assets, relative to inflationary assets over the past 30+ years.
Excerpt from Macro Perspectives, Mon 29 March 21: “Are we seeing the turning point, driven by the unimaginable catalyst of profligate monetary and fiscal action, combined with a global supply crunch and pent-up demand from a global pandemic?
If it is, it would have good company, historically, in terms of major events. If we look back at the periods where inflation assets outperformed deflation assets by 15 percentage points or more, we find three:
1941 - End of the Depression and big government spending through The New Deal. Inflation ramped up to double digits in 1942.
1973 - Oil crisis. Inflation ramped to double digits in 1974.
2000 - Bursting of the dot com bubble. The Fed prevented a spike in inflation, through rate hikes, but crushed the stock market and created recession.
Again, these are historic periods where inflation assets outperformed. It looks like we are in the early stages of another one: buy inflation assets.”


