The inflation report comes in tomorrow morning.
How big of a deal is it?
The past three reports triggered moves in stocks, of a magnitude that has historically (over 25 years of history) only been associated with major events - in each of these past three inflation reports, the S&P 500 has traded in a range of greater than 5%.
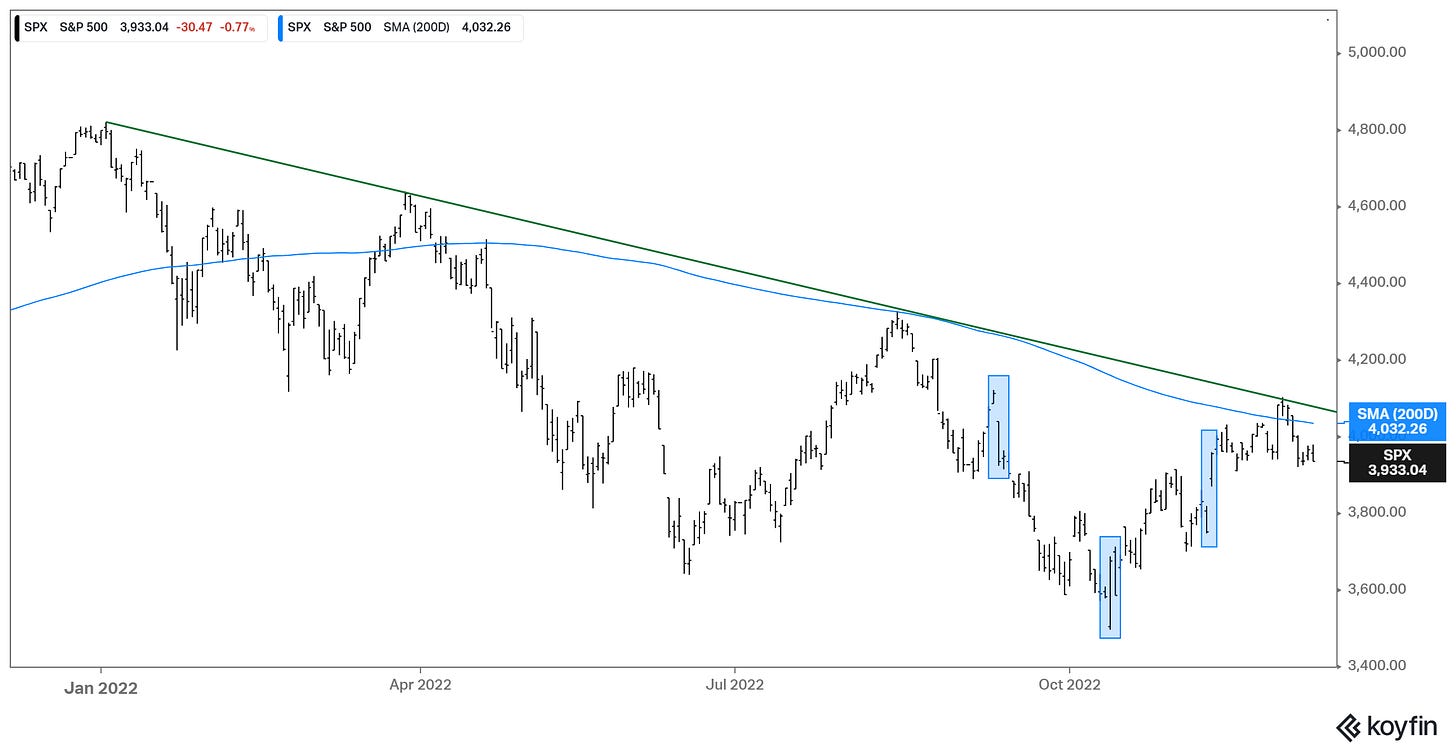
So, this November report should be a doozy, especially since the Fed will decide on rates the day after (Wednesday). Here's what the chart on stocks looks like as we start the week.
The downward sloping trendline (in green) still holds, defining the decline from the record highs. And stocks traded back below the 200-day moving average (in blue) last week. Both of these “technical” levels will likely be tested again this week.
The blue boxes highlight the market behavior surrounding the prior three inflation reports - and it was an inflation report that marked the low of the bear market.
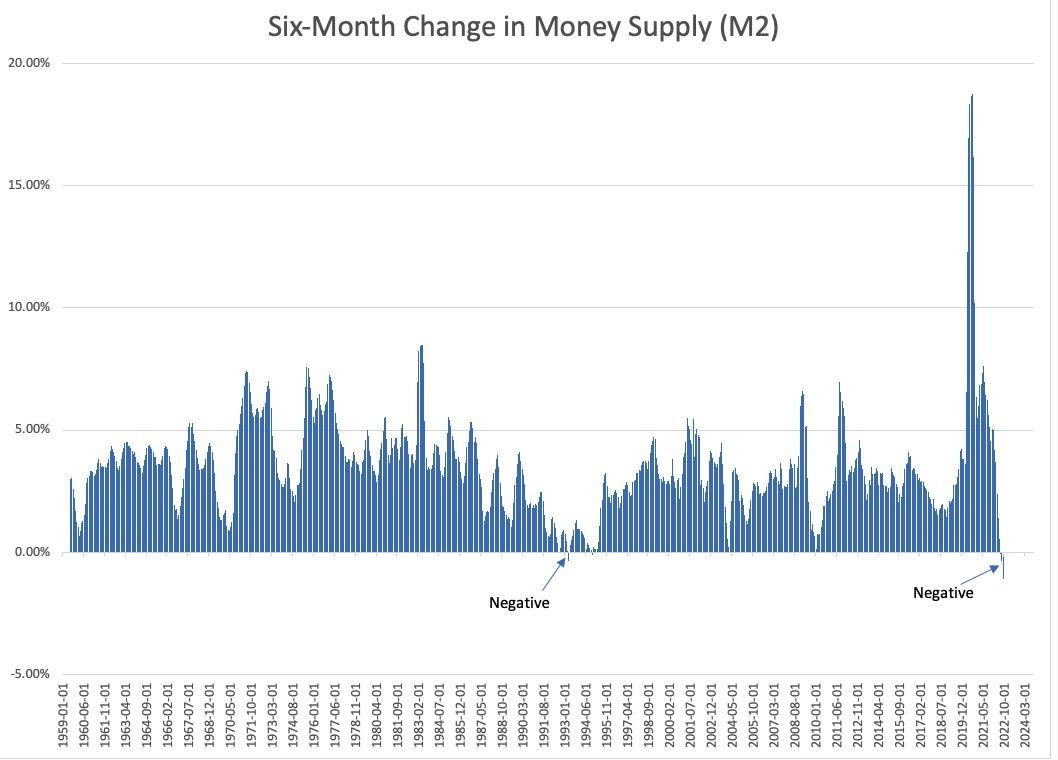
We've talked about the reasons to believe the Fed has actually induced declining prices (deflation), rather than just a deceleration in the rise of prices (i.e. cooling inflation). With this in mind, let's revisit this chart of "six-month change" in money supply...
Money supply is declining, and at the fastest rate on records going back over 60 years of history. Moreover, as you can see in the chart, a negative six-month change in money supply is highly unusual. It's only happened twice prior to this recent episode ('92 and '93).
Deflation is typically associated with a contraction in the supply of money and credit (the former is happening, the latter not yet).
PS: If Repeatable processes and frameworks are your thing: Models, frameworks, and exhaustive research, then join my premium service below:
For a comprehensive understanding of the major talking points in the world of finance this year, click below:


