As we head into the weekend, markets are looking messy - almost everything ended the day in the red.
Once again, the biggest winners on the year (commodities stocks, with very healthy tailwinds) represented some of the biggest losers on the day. On Thursday, it looked like profit taking. On Friday, clearly there was some hedging going into the weekend.
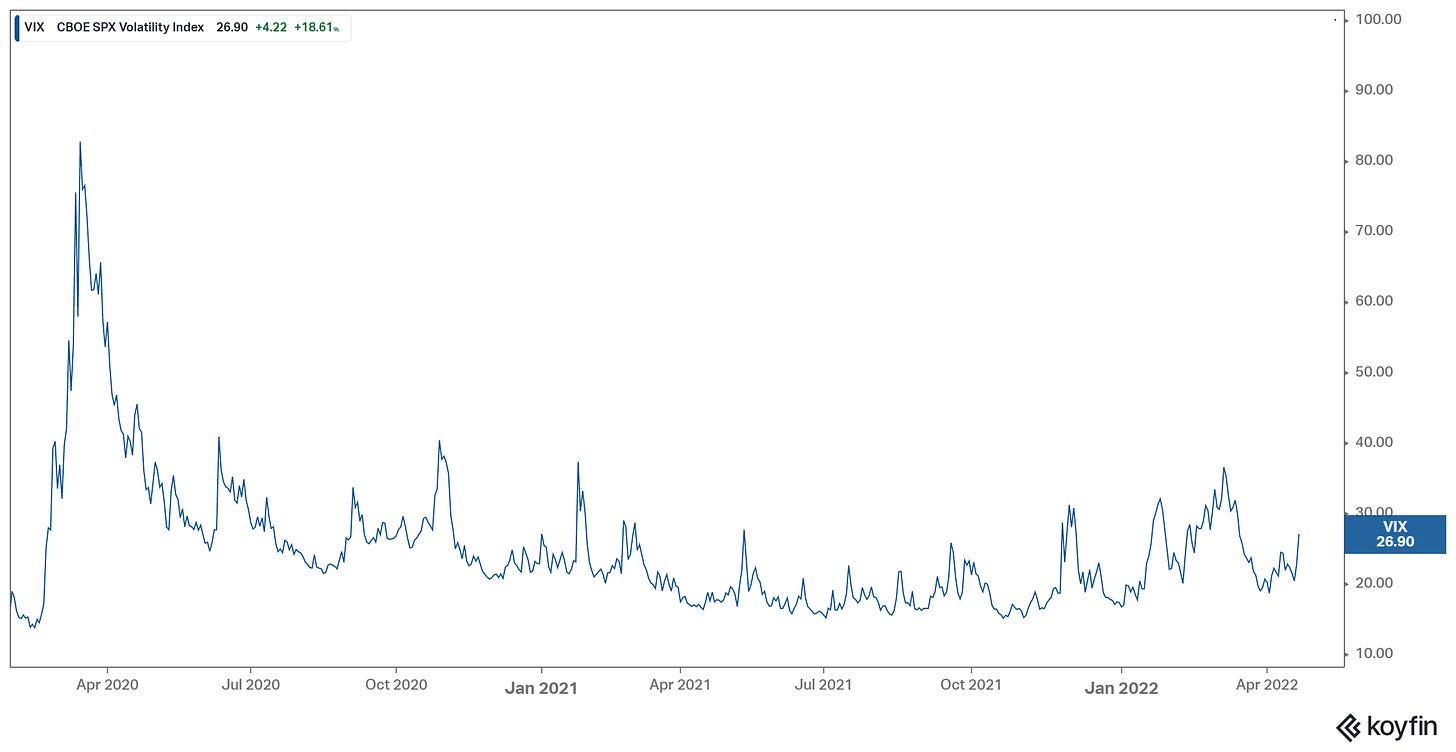
Take a look at the VIX…
The VIX tracks the implied volatility of S&P 500 index options. This reflects the level of certainty that market makers have, or don't have, about the future.
To put it simply, if you are an options market maker, and you think the risk of a sharp market decline is rising, then you will charge more to sell downside protection (ex: puts on the S&P) to another market participant - just as an insurance company would charge a client more for a homeowner’s policy in an area more likely to see hurricanes.
This uncertainty premium translates into the violent spikes in the VIX that you can see on the chart.
Now, with that said, as you can see in the chart, these spikes are not too uncommon, especially in this post-pandemic environment, and the spike on Friday was relatively mild.
But what's the story? What has people concerned?
Is it the fear of more aggressive Fed interest rate hikes coming down the line? Very unlikely. From our discussions we know, even if they moved to their target "neutral level" today (which is around 2.5%), they would still be wildly trailing inflation, and likely still fueling it.
Is it earnings? Q1 earnings season is underway, with 20% of S&P 500 companies already in. Earnings must be terrible, right? The answer is no. So far, 79% of companies have beat earnings estimates with earnings growth running two percentage points higher, at the moment, than the estimate that was set at the end of the quarter.
So, what is creating waves in markets?
Two things.
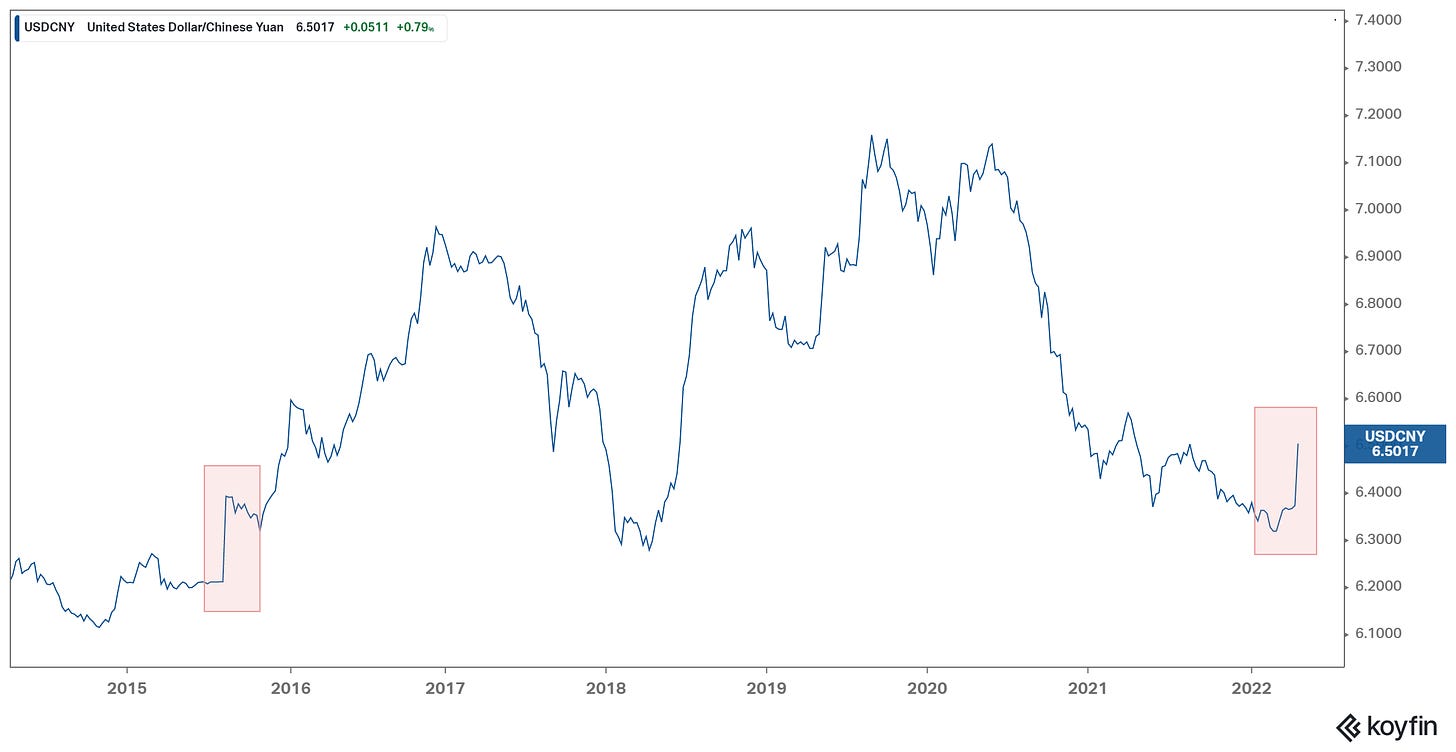
Likely, this chart…
This is a chart of the Chinese Yuan - the rising line represents a weaker yuan versus the U.S. dollar, and vice versa.
As you can see to the far right, we have a spike in the chart (about a 3% drop in the value of the yuan). First, it's important to know that this chart (i.e. the value of the currency) is completely controlled by the Chinese government - they set the value of their currency, historically very cheap, to dominate the world's export market.
So, what's the threat? This price action of the past four days looks very similar to August of 2015, when China threatened a one-off devaluation of the yuan. Stocks fell 10% over a few days back in August of 2015, on the fear that a bigger devaluation was coming, and a global currency war might erupt (tit-for-tat devaluations). This time, as with 2015, it's coinciding with a sharp weakening of the Japanese yen (an export competitor).
So, we should all be paying close attention to this move in the yuan - it also has the potential to introduce China into the fold of global conflict.
What else can be attributed to the waves in markets?
The French Presidential Election - this is a big deal!
The runoff election is Sunday night. We have a candidate, in Le Pen, that could throw a wrench in the globalist agenda, which includes the climate agenda.
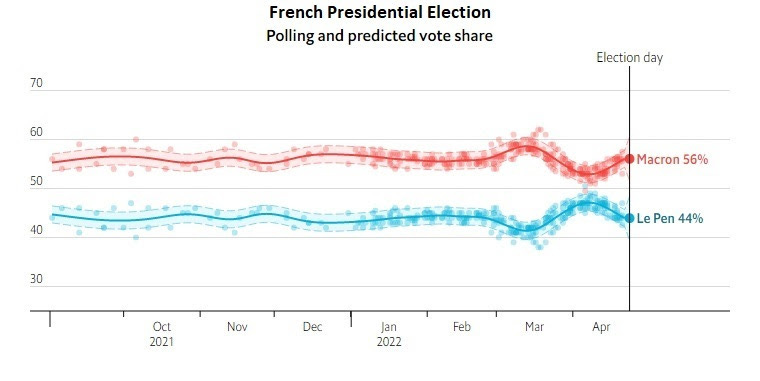
As we've discussed, Le Pen is nationalist candidate running on the platform of regaining French sovereignty. A Le Pen win would pose a risk of disintegration of the European Union, and of the common currency (the euro). To put it simply, Le Pen is to France, what the Grexit vote was to Greece, what the Brexit vote was to the UK, and the Trump vote was to the U.S.
In all of these cases, we headed into the vote with polls that looked like this - all three outcomes went the other way.
France uses paper ballots, cast in person, and counted by hand at the polling station - we should know a winner by Sunday night.


