Second quarter earnings ramp up this week - JP Morgan kicked off the earnings season with another very favorable view toward the strength of consumer and business activity.
Today, let's take a look at an anomaly that has emerged in the bond market.
The 4% threshold in the U.S. 10-year government bond yield (a, if not the, benchmark global interest rate), has been Kryptonite for the global financial system. Time spent above 4%, in this post-pandemic world, has a short but consistent record of "breaking things" in the financial system.
With that, in my July 6th note ( here ), we looked at the below technical setup in the 10-year, where once again, it looked like the 4% level would be revisited.
Indeed, it traded up to 4.09% over the next few days. Guess what else happened in early July? This 10-year swap spread blew out (right side of this next chart).
The chart above represents the difference between the 10-year yield and the 10-year interest rate swap (IRS). Without getting into the mechanics, let's just look at the comparables on the chart.
The last time we had a severe spike like this was March 2020. It spiked on the lockdown, and reverted the following week with the accompaniment of massive Fed intervention.
Before that, it was August of 2015. The Chinese surprised markets with a devaluation of the yuan. It was a modest adjustment in the currency, but global markets reacted on the prospects that a big one-off devaluation may follow, to support its flagging economy.
Prior to that, the closest degree to which we've seen this magnitude and speed of spread expansion was following Lehman Brothers bankruptcy in October of 2008. Obviously that's not a friendly comparison.
All three of these past episodes came with negative shocks in the stock market, and (related) spikes in the price of downside stock market protection (reflected in the VIX).
The good news: The 10-year yield has fallen back, aggressively - now comfortably below 4% at 3.8%.
Also good news: Stocks haven't had a negative shock.
And if we look at the VIX, it's at three-year lows - the lowest in the pandemic/post-pandemic era.
The VIX tracks the implied volatility of S&P 500 index options. This reflects the level of certainty that market makers have, or don't have, about the future.
To put it simply, if you are an options market maker, and you think the risk of a sharp market decline is rising, then you will charge more to sell downside protection (eg: puts on the S&P) to another market participant - just as an insurance company would charge a client more for a homeowner’s policy in an area more likely to see hurricanes.
An "uncertainty premium" would translate into the violent spikes in the VIX that you can see on the chart. Again, as you can see in the far right of the chart above, we haven't had it. So, what would cause this quick round trip (up and back down) in the 10-year U.S. Treasury yield, the most important bond market in the world (chart below)?
Maybe a good inflation report is attributable to this fall back in yields. We had one last week.
Or maybe it was a stress event in the financial system. If that were the case, we know, with certainty, how the Fed has responded, and will continue to respond, to shocks - they will intervene, to plug the holes.
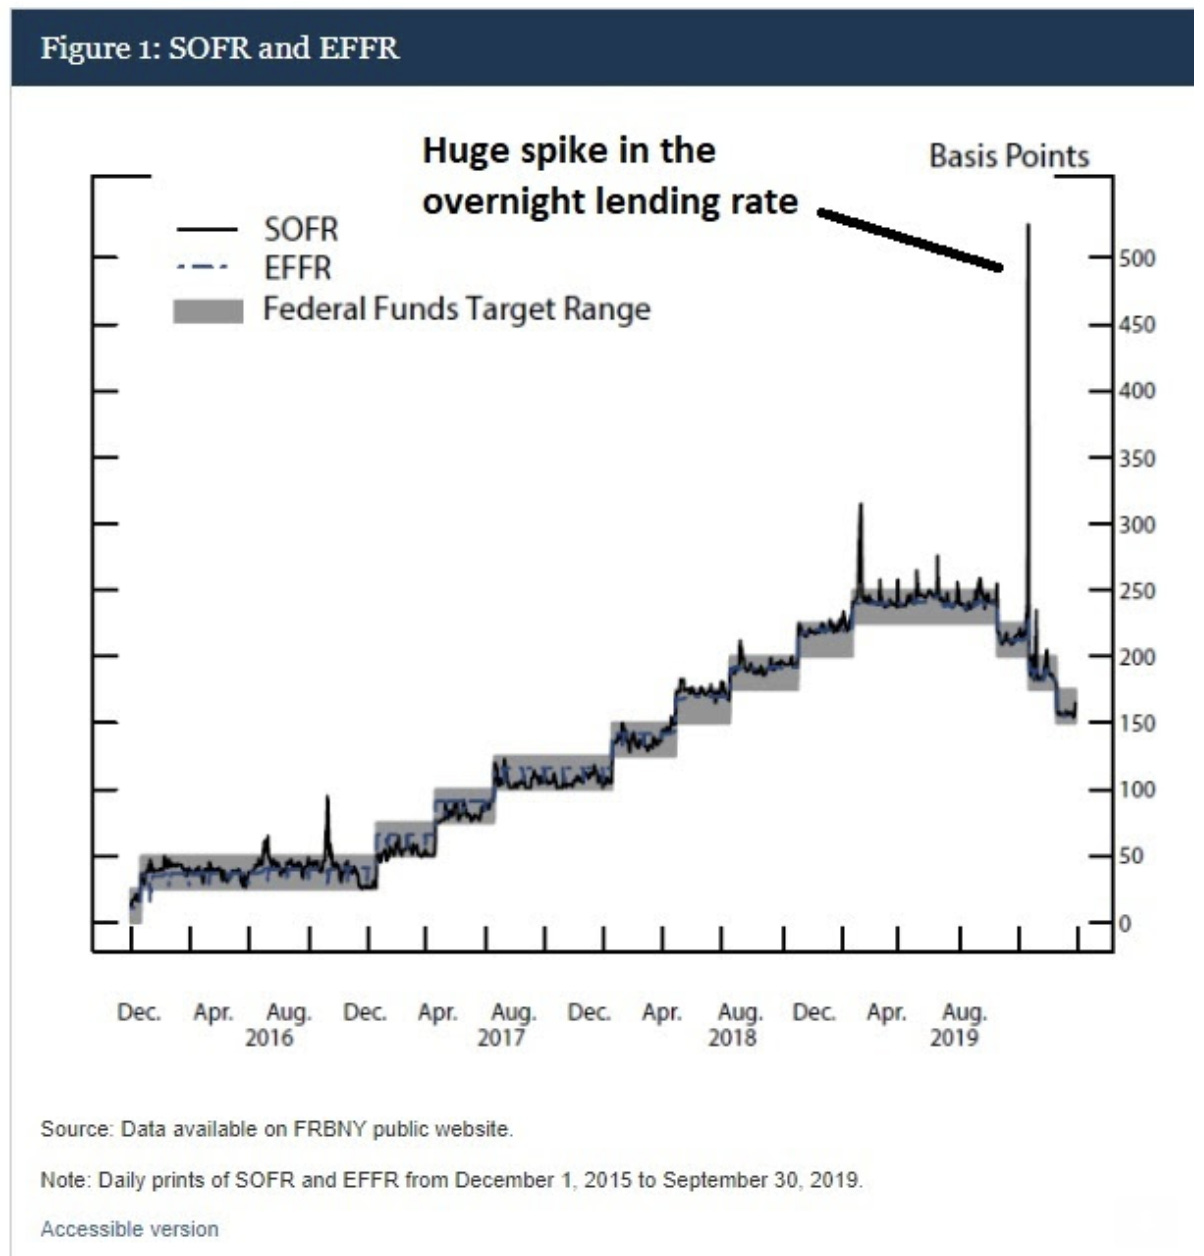
Remember, back in 2019, when the Fed was about two years into its first attempt at quantitative tightening, this happened . . .
The Fed described this chart above as: "strains in money markets that occurred against a backdrop of a declining level of reserves, due to the Fed's balance sheet normalization and heavy issuance of Treasury securities."
More simply, the Fed was forced to rescue the overnight lending market (between the biggest banks in the country) because of an unforeseen consequence of balance sheet "normalization."
What was their response? They quickly, but quietly, returned to expanding the balance sheet. As Bernanke once said, QE tends to make stocks go up - stocks went up close to 20% over the following four months. With all of the above in mind, here's the look at the latest Fed balance sheet.
Interestingly, in last week's report, there was a considerable slowing in quantitative tightening. We'll see in this week's report if there's any indication that trouble has been brewing in the interest rate market.
PS: If you found this note of value, or know someone who may benefit from reading it, click on the link above to pass it along.


