


Growth Shift


US stocks ended the week with a roller-coaster ride after the White House denied reports that President Trump was delaying tariffs by a month and confirmed his plans to impose tariffs on Mexico, Canada, and China this weekend, erasing earlier gains in equities.
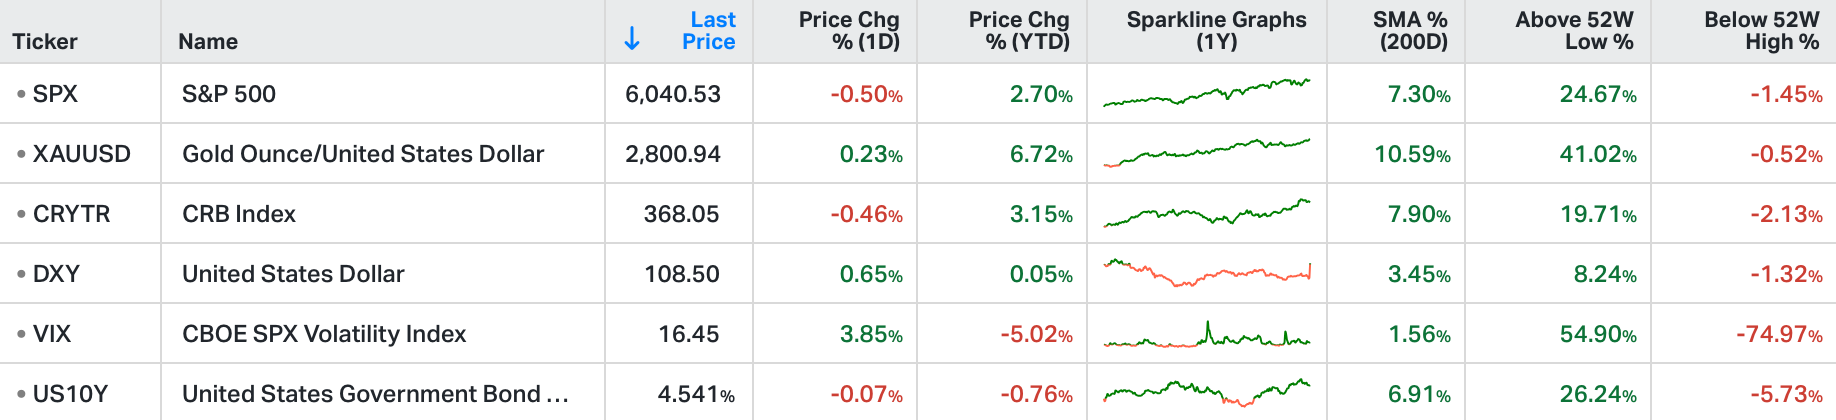
The S&P 500 dropped 0.5%, the Dow trimmed 310 points, while the Nasdaq 100 edged lower.
Additionally, Exxon Mobil and Chevron fell 2.5% and 4.6%, respectively, after reporting their results.
On a possitive note, AbbVie rose 4.7% after its forecast 2025 earnings were above Wall Street’s average expectation as two key medicines gained ground.
Meanwhile, the market barely budged after the US Core PCE inflation gauge met estimates, with markets continuing to bet on two rate cuts by the Fed this year.

Fourth quarter GDP grew at an annualised rate of 2.3% (the advance estimate released by the Bureau of Economic Analysis on Thursday). Although this was slower than the third quarter growth of 3.1%, some of the underlying metrics were very strong:
Personal consumption expenditures were up 4.2%
Real final sales of domestic product were up 3.2%.
The headline growth number was held down by companies selling product that they had purchased in prior quarters. The decline in inventories created a 90-basis point drag on the headline number.
Meta reported earnings and guided its capital expenditure budget for 2025 to range of $60-65 billion - an increase of roughly $20 billion from their previous guidance.
Microsoft reported quarterly capital expenditures at $22.6 billion which is a level of spending it intends to maintain for the next several quarters.
Measurements of U.S. economic activity today show solid growth. From a stock standpoint, the largest beneficiaries of growth over the past year(s) have been the Magnificent Seven stocks. The Magnificent Seven stocks and Broadcom now represent the eight largest companies (measured by market capitalisation, ex-Aramco) in the world.
Year-to-date, the sector ETFs for financials, materials, energy, industrials and health care are out-performing the S&P 500 and the technology ETF. This earnings season, we are seeing signs that growth beneficiaries may be shifting to include a broader array of companies.

The world’s 10 largest companies measured by market capitalisation (ex-Aramco) are all U.S. companies. Historically, when companies become a top 10 company based on valuation, their stock performance lags the S&P 500 over the next ten years. The current list of top ten companies have many positive attributes including rapidly growing end markets, leading innovation, high barriers to entry, strong balance sheets, stock buybacks, scale advantages in a world driven increasingly by R&D, high profit margins, etc. These attributes are unlikely to suddenly change. But, if history is our guide, we should keep an eye on where growth may shift next.

In the table above, dark grey boxes signify outperformance over the next 10 years. Light grey boxes signify underperformance. In each decade, the majority of the top-ten companies delivered underperformance relative to the overall stock market in the subsequent 10-year period.