On Monday we talked about the potential for another 1973-like oil embargo.
Yesterday morning, OPEC-member Iran called for just that, sanctioning Israel - which would likely, quickly, be imposed on those countries supporting Israel.
It was dismissed in the media by other OPEC members. But by the day's end the U.S. Treasury was relaxing sanctions against Venezuela (which is an OPEC member), freeing up access to Venezuelan oil, gas and gold.
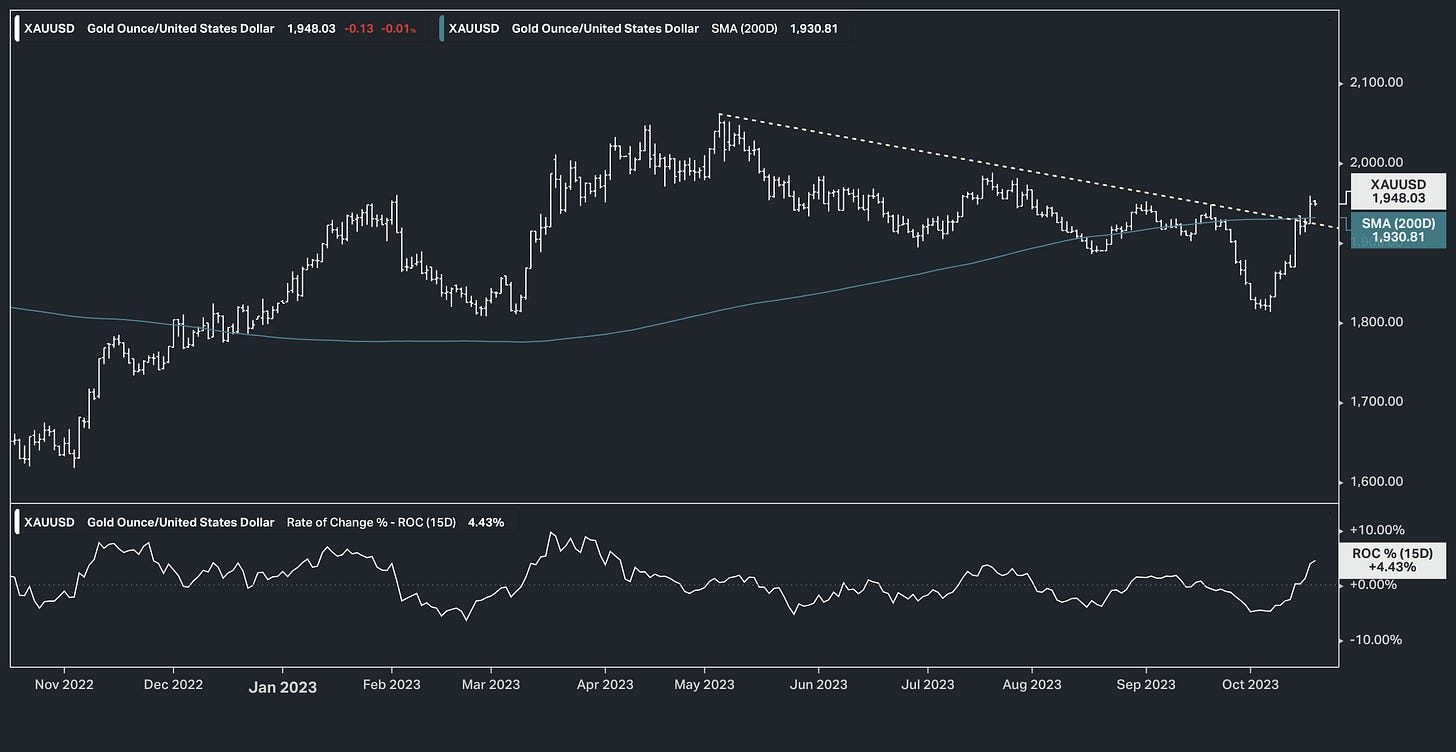
We looked at the gold chart on Tuesday, which had another big day yesterday, breaking out of this cyclical downtrend.
There has fundamentally been a greenlight to buy gold for some time, given the explicit (global) policies to inflate asset prices and inflate away unsustainable sovereign debt.
It's the historic inflation hedge, yet it has been among the worst performing asset class over the past three years. Since the first, massive, covid policy-response in March of 2020;
stocks (S&P 500) are up over 80%,
oil is up four-fold,
copper is up 90%,
real estate (the Case-Shiller Home Price Index) is up 44%.
Gold is up just 25%.
And yet, central banks bought gold in record amounts last year. Has there been manipulation in the gold market? Price suppression?
Or is it Bitcoin? Did Bitcoin supplant gold as the favored hedge against inflation and money printing profligacy? Indeed, the price has jumped multiples over the past three years.
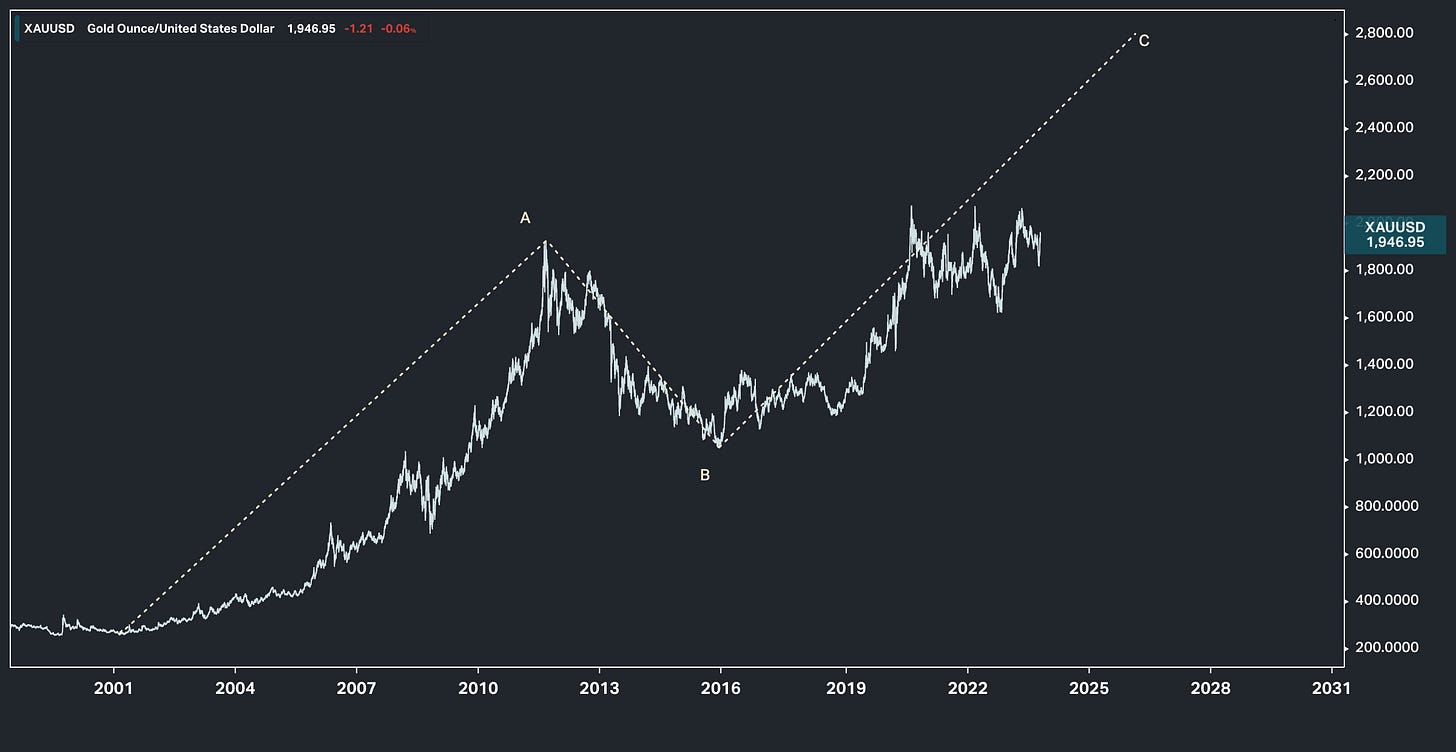
I suspect in a march toward global war (as it appears), people want gold over bitcoin. With that, we've often looked at this longer-term chart of gold over the years.
This is a classic C-wave (from Elliott Wave theory). This technical pattern projects a move up to $2,700ish. The price of gold has continued to make progress along that path.
How do you play it? Get leveraged exposure to gold through gold miners, or track the price of gold through an ETF, like GLD.


