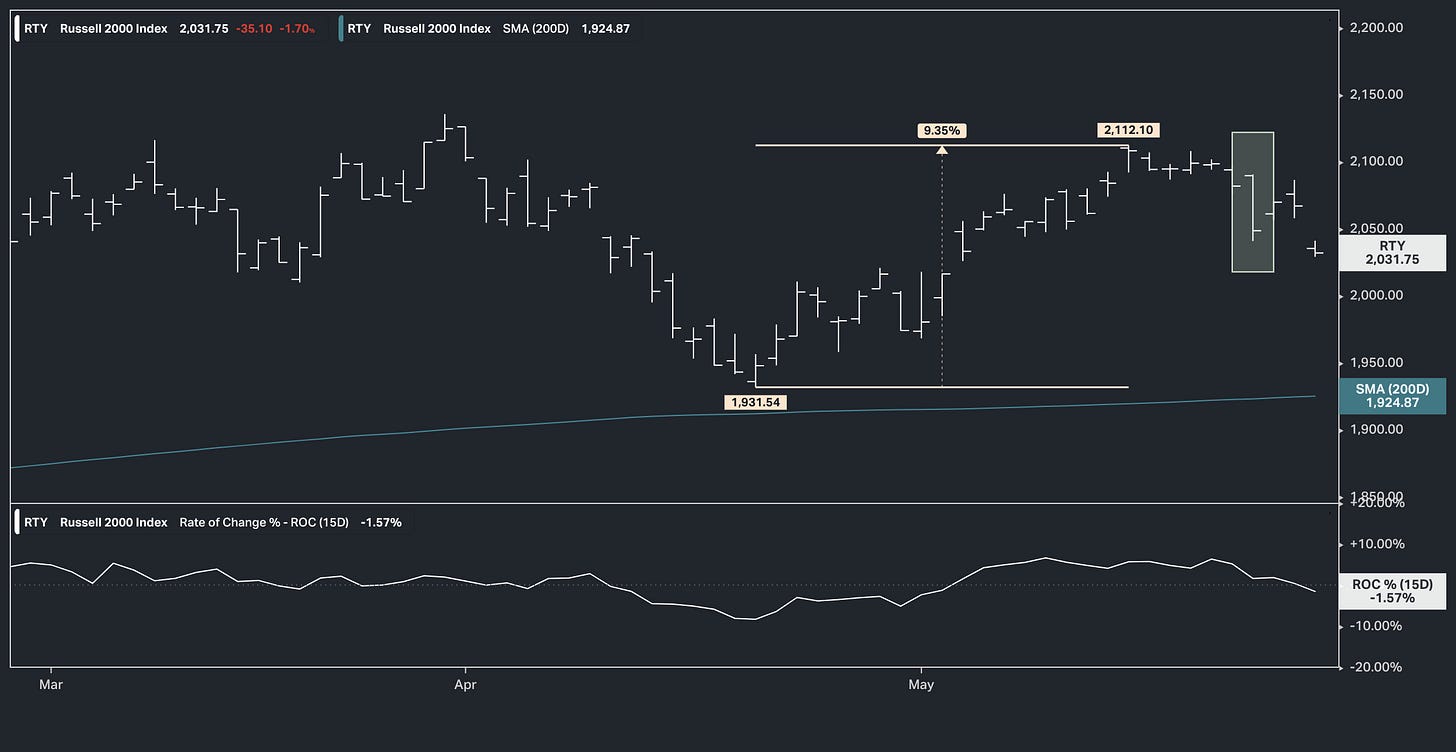
Last Thursday, following another huge earnings event from Nvidia, the S&P futures and the Nasdaq put in a technical reversal signal (an outside day). The Russell 2000 (small caps) moved sharply lower, breaking the trend of the past month that described a 10% bounce from the April lows.
So, stocks shrugged off the Nvidia news, and all of the related insider insight into the new industrial revolution. With that market behaviour in mind, we stepped through some notable geopolitical and domestic risks that were bubbling up:
The U.S. Treasury Secretary had just made public comments prior to the G7 Finance Ministers meeting in Italy, where she took some provocative shots at both Russia and China, signalling coordination among G7 partners to transfer ownership of seized Russian assets.
Adding to that, she vowed a “wall of opposition” to China’s trade practices.
And then, as we also discussed yesterday, the date for closing arguments was set in the Trump trial in New York, which put a timeline on a potential conviction.
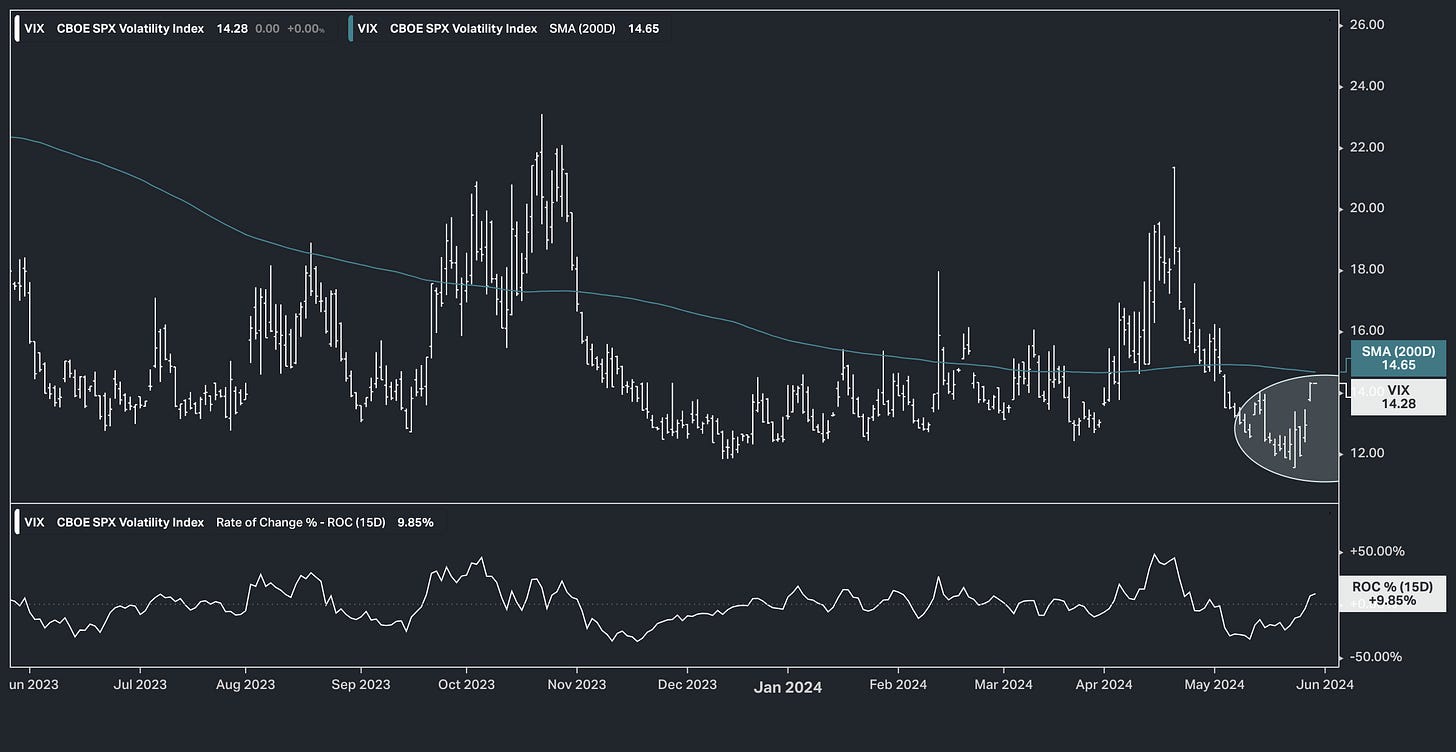
With all of this, the market seemed to be underpricing the rising geopolitical and domestic news risk, if not shock risk - as you can see in the chart of the VIX.
So fast forward to today, and the Trump trial has now moved to the jury deliberation stage. Markets were down across the board (stocks, bonds, commodities).
Is this trial "noise" or "signal" for markets? If it alters (and maybe permanently) market psychology and perception, it's a signal.
In this case, the potential jailing of a U.S. presidential candidate driven by partisan lawfare should raise concerns for every investor about America's role in the world as the reliable anchor of law, fairness, and stability. Add that to the threat of confiscating Russian assets, and it's not hard to imagine the erosion of trust in the "full faith and credit" which underpins the U.S. Treasury market - the dollar (and fiat currencies, in general) works only with trust and credibility of the issuing government.
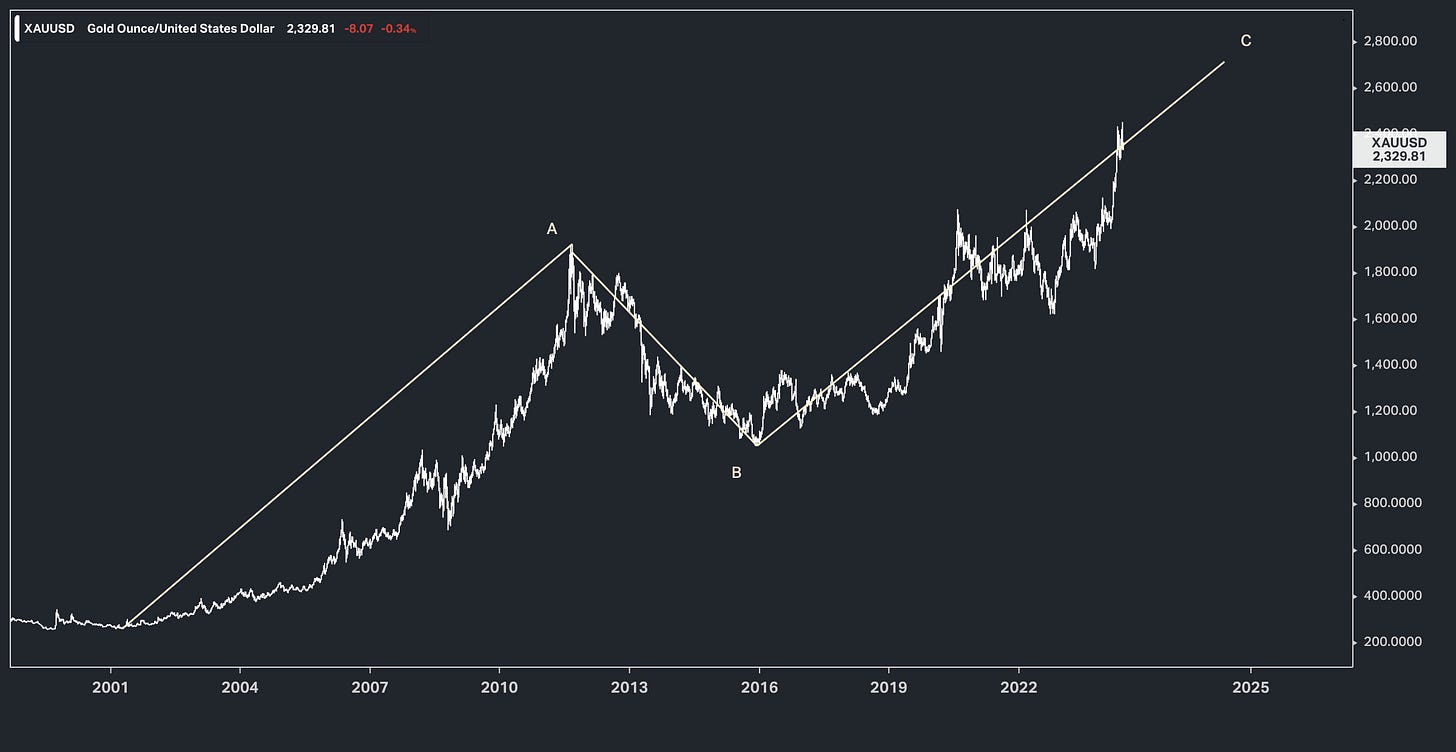
Clearly these are scenarios we don't want to see play out. The vulnerabilities are already well known, particularly after the ramp in debt and deficits in recent years. Introducing a catalyst becomes very dangerous. This all strengthens the case for the continuation of the trend in this chart (and commodities, in general - up!) …
We've often looked at this longer term chart of gold over the years (Nov 2020 and Oct 2023 ). This is a classic C-wave (from Elliott Wave theory) - this technical pattern projects a move up to $2,700ish. The price of gold has continued to make progress along that path.
How do you play it? Get leveraged exposure to gold through gold miners, or track the price of gold through an ETF, like GLD.
The chart above shows the 10 single stock equity - GDX constituents in green’s, GDXJ constituents in red’s - tickers analysed in the Gold | Alpha Analysis chartbook from 23 Oct’23. You can access the above type of research, alongside 3 guided portfolio’s, by clicking on the link below.
Sign up now.
Get research & portfolio allocations on the weekend.
Implement the portfolio(s) of your choosing on Monday 03 June 2024.


Interesting take on the impact on the world's impression of the status of legal rights in the wake of the Trump verdicts this afternoon. foreign investors always knew that their money would not be confiscated, but between the Russian central bank assets and now the Trump verdict in an obviously political scenario, are foreign investors as confident? feels dollar and bond negative, equity negative and likely commodity positive. maybe too early for that in a big way, but perhaps the beginnings of a new trend