We got the April inflation report - the year-over-year price change came in just under 5%, making it the slowest rate-of-change in the headline inflation number since April of 2021.
Most interestingly, this number is going to fall off a cliff by June. Because of this . . .
The April number reported was against the low base (May base - circle) shown in this chart above. By June, that base (June base - square) will rise dramatically. Even if inflation runs at a hot rate of 1/2 percent per month, from now through June, the year-over-year June inflation number would be 3.4%.
If inflation were to be flat over the next two months, the year-over-year June inflation would be in the mid-2s (percent) - converging on the Fed's target!
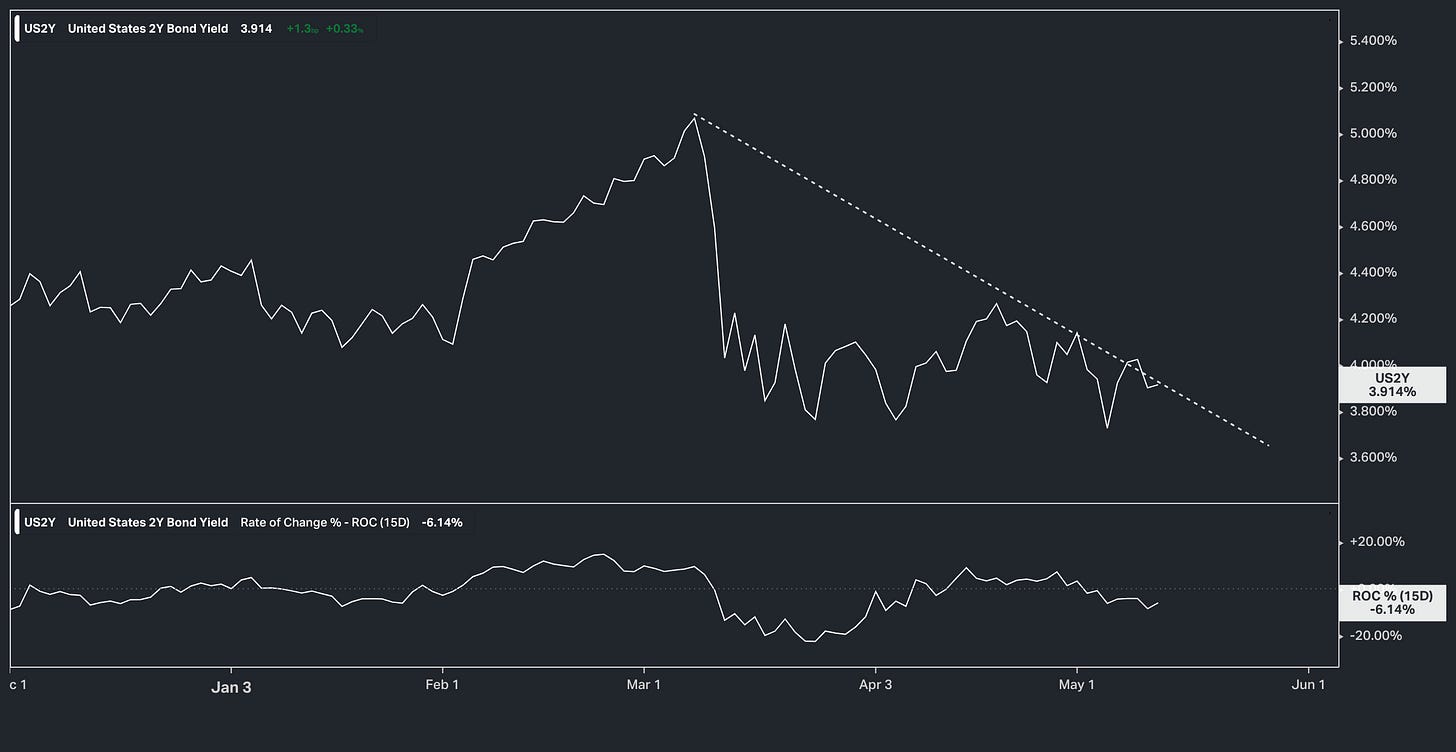
This is precisely why the interest rate market was pricing out any chance of a June hike and why the market is now looking for 75 basis points in cuts by year-end. This scenario would align with the message the 2-year yield is sending . . .
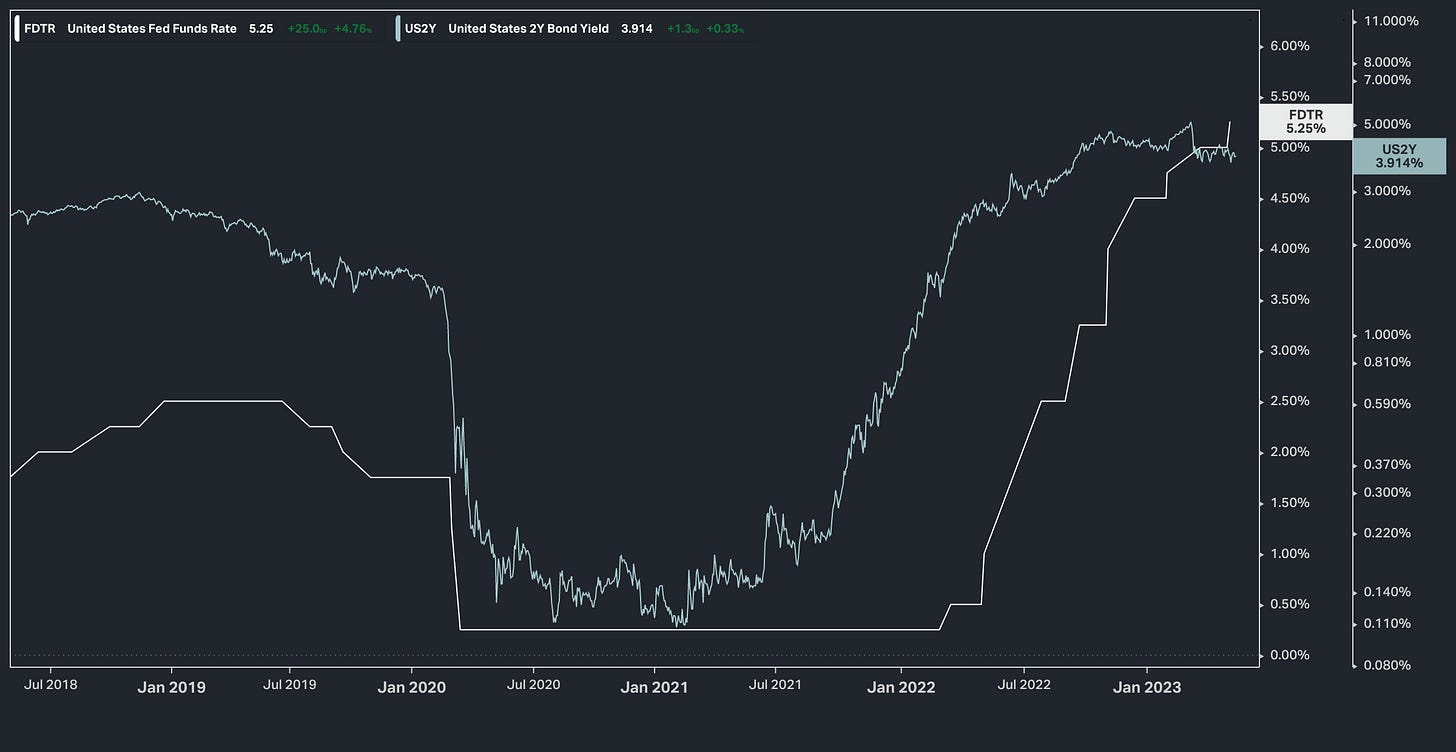
The 2-year was trading at a “technical” inflection point going into this number - and resolved with a big move lower. Let's take a look at where this leaves the spread between the Fed Funds rate and the 2-year yield (i.e. the difference between where the Fed has set short-term rates, and the market's judgement on where rates should be) . . .
The market is 118 basis points lower. The tightening cycle should be done.
With that, nothing has had more influence on stocks over the past sixteen months than inflation, and the fears over a draconian Fed response to it. And with the end of tightening, we are left with this chart.
In previous notes I highlighted a descending trendline representing the bear market of last year, stocks have broken above it and above the 200-day moving average. The next technical level to watch is 4200 - that's only 1% away.
Meanwhile, we're just coming to the end of Q1 earnings season, which was expected to be the worst quarter of the year for corporate America, with a recovery in earnings growth expected to come in the second half.
But the Q1 reports have been full of positive surprises. As of last Friday, 85% of companies had reported, with above average earnings beats (79%). To add, the earnings contraction, at that point, was just 2.2%, versus expectations coming into the earnings season of 6.7%.
This also comes as the institutional investment community is positioned in a very bearish stance (twenty-year extreme short positions from the leveraged futures traders, and global fund managers most bearish stocks, relative to bonds, since 2009).
As we've discussed, these are contrarian indicators.
For those looking to cherry pick stocks as we break above 4200, you can do so by building on a base of institutional grade analysis:


