


Charts of the Week: Uncertainty Lingers

Despite escalating global economic uncertainty - driven in large part by US tariff policies - equity markets have continued to surge, seemingly shrugging off risks that would typically provoke caution. This disconnect has grown more conspicuous in the wake of last week’s downgrade by Moody’s of the US sovereign debt outlook, which underscored mounting concerns over fiscal sustainability. Beneath the surface of the market rally, however, a series of signals suggests a more nuanced and potentially fragile backdrop.
Before we get into this week’s theme, here are some macro updates (charts & diffusion scores) we published on Long Form this week:
If you find this of value, or know someone who may benefit from reading this, please share this note with them.
If you have investment performance responsibility or are managing financial risks, become a member to access our Global Trend Report (more info).
Uncertainty and market volatility
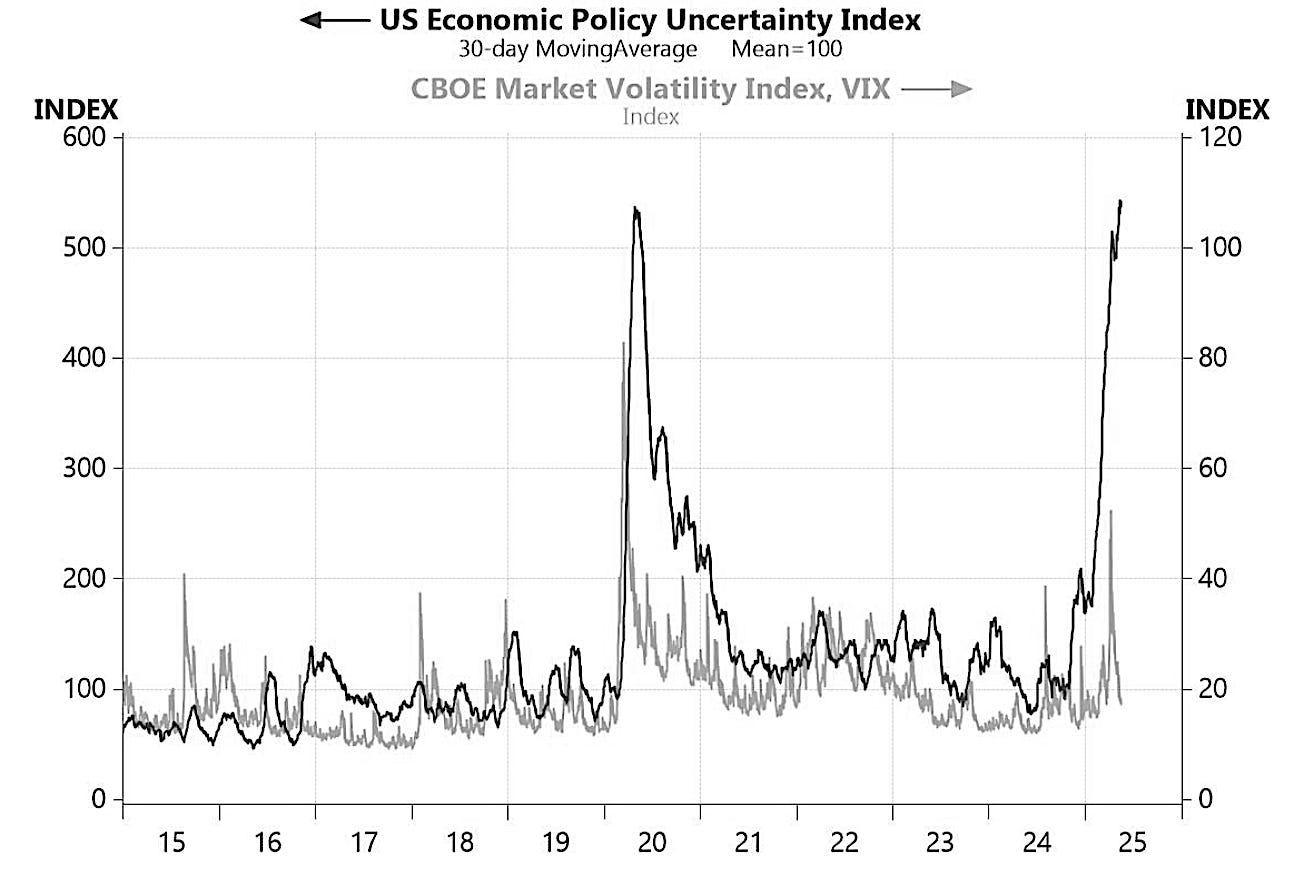
Our first chart this week highlights the dramatic spike in US economic policy uncertainty that followed the announcement of sweeping new U.S. tariffs in early April, a move that reignited global trade tensions and sent shockwaves through markets. The surge in the Economic Policy Uncertainty (EPU) Index was accompanied by a sharp rise in the VIX - Wall Street’s so-called “fear gauge” - as investors grappled with the implications of a more protectionist stance and the potential for retaliation. However, in the weeks since, as the administration has partially walked back some of the more aggressive trade measures, markets have responded positively: the VIX has retraced most of its gains, reflecting a rebound in investor sentiment. Yet, the EPU index remains at elevated levels, suggesting that while market volatility has subsided for now, underlying uncertainty around the future direction of trade policy - and its broader economic impact - continues to loom large.
Markets and data surprises
This second chart shows the sharp rebound in global equity markets has unfolded alongside a steady improvement in economic data surprises. After a dip in April, the Dow Jones Global Index (excluding the U.S.) has surged in recent weeks, mirroring a notable uptick in the Citigroup Economic Surprise Index - a measure of how actual economic data compares to expectations. The surprise index, having recovered from negative territory in April, is now firmly positive, suggesting that recent global data releases have consistently exceeded forecasts.

US, European and China data surprises
This next chart, however, illustrates that these global gains in growth surprises have accompanied a widening divergence in data surprises across the major regions. Since late April, the China growth surprise index has surged, indicating that Chinese economic data have consistently outperformed expectations - likely reflecting supportive policy measures and a rebound in industrial activity. In contrast, the US has remained far more subdued.

US Financial Conditions
This fourth chart illustrates the Fed’s estimates of how various components of US financial conditions have contributed to growth over the past several months, with the net impact swinging from a notable tailwind in early 2024 to a much smaller one by April 2025. That shift reflects less supportive financial conditions across several components. The US dollar, in particular, has shifted from exerting a loosening influence in early 2024 to acting as a modest headwind in recent months - consistent with its trend toward appreciation. At the same time, equity markets and credit conditions continue to provide mild support, though less than before. The earlier boost from falling Treasury yields and lower mortgage rates has also started to fade.

Japan’s investor flows
Japanese investors staged a notable reversal in the week ending May 9th, shifting from sustained net selling of foreign bonds to a sharp uptick in net purchases. This turnaround came just ahead of a rise in US Treasury yields - suggesting that the surge in buying may have preceded heavier selling pressure triggered by Moody’s downgrade of the US credit outlook. Looking specifically at Japan’s holdings of Treasuries, the data show a steady build-up over the first quarter of the year. However, those gains predate the US “Liberation Day” tariffs and the ensuing rise in geopolitical and economic uncertainty. In the wake of these developments, Japanese investors may now face stronger incentives to pare back their US debt exposure.

Energy consumption in Asia
This final and more structurally-rooted chart illustrates the dramatic divergence in per capita primary energy consumption between China and several other large, fast-growing developing economies—namely India, Indonesia, and Bangladesh - from 1975 to the present. China’s energy consumption per person has surged over the past two decades, particularly after 2000, mirroring the country’s rapid industrialisation, urbanisation, and rise in living standards. As of the most recent data, China's per capita energy use exceeds 30,000 KWh per person, placing it far ahead of its regional peers and underscoring the scale of its development. In contrast, India, Indonesia, and Bangladesh have seen only gradual increases. Although India and Indonesia have more than doubled their per capita consumption since the early 1990s, they remain well below China - each hovering below 11,000 KWh per person. Bangladesh, while growing steadily, remains at a much lower base. The chart highlights a key point: if these populous nations follow anything like China’s energy-intensive path to industrialisation and middle-income status, global energy demand could rise sharply. This poses significant implications for energy markets, climate targets, and infrastructure planning in the years ahead.

GRYNING | Trader: An information package designed for institutional investors & passionate retail investors. For those who require active dynamical risk assessment and comprehensive market analysis.
