


Charts of the Week | Trade Shocks

For some further views on the impact on the world economy of recent US tariff policies, please see the 2 notes below, published on the Long Form section this week:
Trade policy uncertainty and geopolitical stress
Our first chart this week illustrates the sharp escalation in US trade policy uncertainty that has unfolded over the past few months. The US Economic Policy Uncertainty Index for trade policy has specifically surged to multi-decade highs, reflecting heightened concern about the direction and credibility of US trade actions under the new administration. This jump unfolded ahead of the major policy announcement from the US administration on April 2nd.
Simultaneously, the Caldara and Iacoviello Global Geopolitical Risk Index has also moved sharply higher in recent weeks, indicating growing unease over multiple flashpoints, including tensions in the Middle East, Eastern Europe, and US-China relations.
Together, these indicators highlight the growing complexity and fragility of the global economic environment. They also underscore why financial markets are finding it increasingly difficult to anchor expectations—caught between shifting trade alignments and mounting geopolitical stress.

US data surprises and stagflation
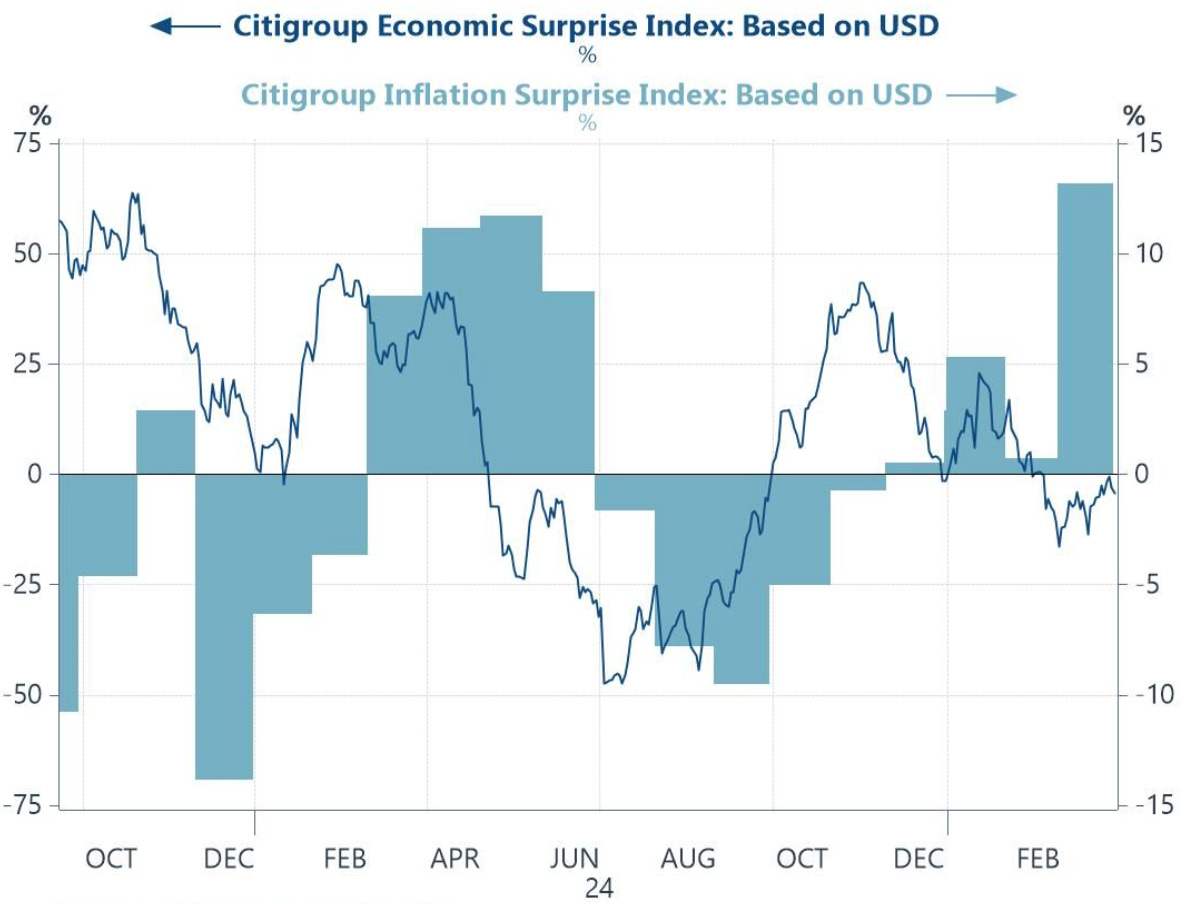
Chart 2 below highlights the recent divergence between economic and inflation surprises in the United States. The Citigroup US Economic Surprise Index has fallen sharply and into negative territory in recent weeks, reflecting a consistent pattern of weaker-than-expected growth data. At the same time, the Inflation Surprise Index has been climbing, indicating that inflation readings are coming in above consensus expectations.
This combination—disappointing growth alongside stubborn price pressures—reflects a stagflation-lite scenario, and one that could now worsen in the immediate months ahead.
Consensus expectations for Central Bank policy
This next chart illustrates the latest consensus expectations from Blue Chip Financial Forecasters panel for policy rates across major economies over the next 12 months. These were pulled together before this week’s US announcement so may now be a little dated. Still, the consensus had already been pointing firmly toward an easing bias, particularly in the UK, Euro area, and United States. And this reflects growing concern about weakening economic momentum and the need for monetary policy to counteract downside risks.
The UK, where rate cuts are most aggressive, is facing one of the sharpest growth slowdowns among developed economies, while the Eurozone’s dovish pivot has been supported by softer-than-expected inflation data, as we discuss below. In contrast, Japan stands out as the only major economy where modest rate hikes are still anticipated, driven by nascent signs of inflation persistence and the Bank of Japan’s desire to normalize policy.

The euro area labour market
This next chart shows two important indicators of labour market dynamics in the Euro Area: employment expectations (from the EC survey) and posted wage growth based on Indeed job ads (line). Both series have been trending lower, suggesting that the euro area labour market is cooling. The decline in employment expectations signals increasing caution among employers about future hiring plans—likely a response to slower growth, tighter financial conditions and, more recently, US trade policy uncertainty.
At the same time, wage growth has eased steadily over the past year, reinforcing the view that second-round inflation pressures from the labour market are subsiding. This softening in labour indicators has given the European Central Bank additional room to begin discussing further interest rate cuts, particularly as headline inflation readings have also surprised to the downside.

China’s economy
Chart 5 below illustrate the Yicai High Frequency Economic Activity Index (YHEI), which tracks real-time fluctuations in China’s economy based on a range of mobility, transport, and consumption indicators.
After several quarters of sluggish activity, the index has recently rebounded to its highest levels in over a year. This upswing suggests a tentative revival in domestic economic momentum, supported by targeted fiscal stimulus, easing credit conditions, and a modest improvement in consumer sentiment. The rebound clearly comes at a critical moment for China, as policymakers seek to offset US tariff policies and persistent weaknesses in the property sector.
These imply that the sustainability of this pickup remains uncertain, but they have reinforced the narrative that China is leaning more heavily on proactive fiscal and quasi-fiscal tools to stabilise growth in 2025.

World trade
Our final chart this week combines two leading indicators of world trade: South Korea’s merchandise exports and the Global Real Economic Activity Index in Industrial Commodity Markets.
Both series have turned decisively lower in recent months, underscoring some persistent weakness in global goods demand. South Korea, often considered a bellwether for global trade due to its exposure to tech and industrial supply chains, has reported multiple months of year-on-year export declines. At the same time, commodity-linked activity—an important proxy for industrial production and construction globally—has also faltered.
The high historical correlation between these two series amplifies the signal that global trade is under stress. And with the US administration unveiling additional trade barriers this week, downside risks to export-dependent economies are becoming much more acute.

Position Your Portfolio for Success by adding GRYNING to your Investment Process;
Cutting Edge Research → GRYNING | Research
Ready to Use Strategies → GRYNING | Quantitative
Scalable Solutions → GRYNING | Valuation Model