


Charts of the Week | Reversal of Fortunes

Investing by Design is for traders and portfolio managers who want to hit the ground running with access to robust, institutional-grade daily, weekly, and monthly signals and trading strategies. The limited time offer for new members closes tomorrow, at midnight, click on the button below to secure your membership.
US equity markets
Chart 1 below highlights how the US equity market has historically responded well to positive economic surprises but faltered when growth data disappointed, a trend that has resurfaced in early 2025. Investor concerns have intensified as the Trump administration's policies have raised fears of supply-side constraints and stagflation. The latest downturn in growth surprises suggests the US is losing momentum faster than anticipated, fuelling recession speculation just as policy uncertainty and still-tight monetary conditions weigh on corporate earnings.

US capital flows
Against this backdrop, the US dollar and foreign demand for US financial assets are also in focus. Chart 2 shows a clear (albeit, loose) relationship between movements in our (internal) calculation for the broad nominal effective US exchange rate and net private sales of U.S. domestic securities—with periods of dollar strength coinciding with increased foreign purchases of US assets. However, recent volatility suggests that global investors may be reassessing their appetite for US securities. A stronger dollar, often a symptom of risk aversion, has historically attracted capital inflows, but persistent trade frictions could lead to capital flight if investors begin to question the long-term implications for US economic stability.

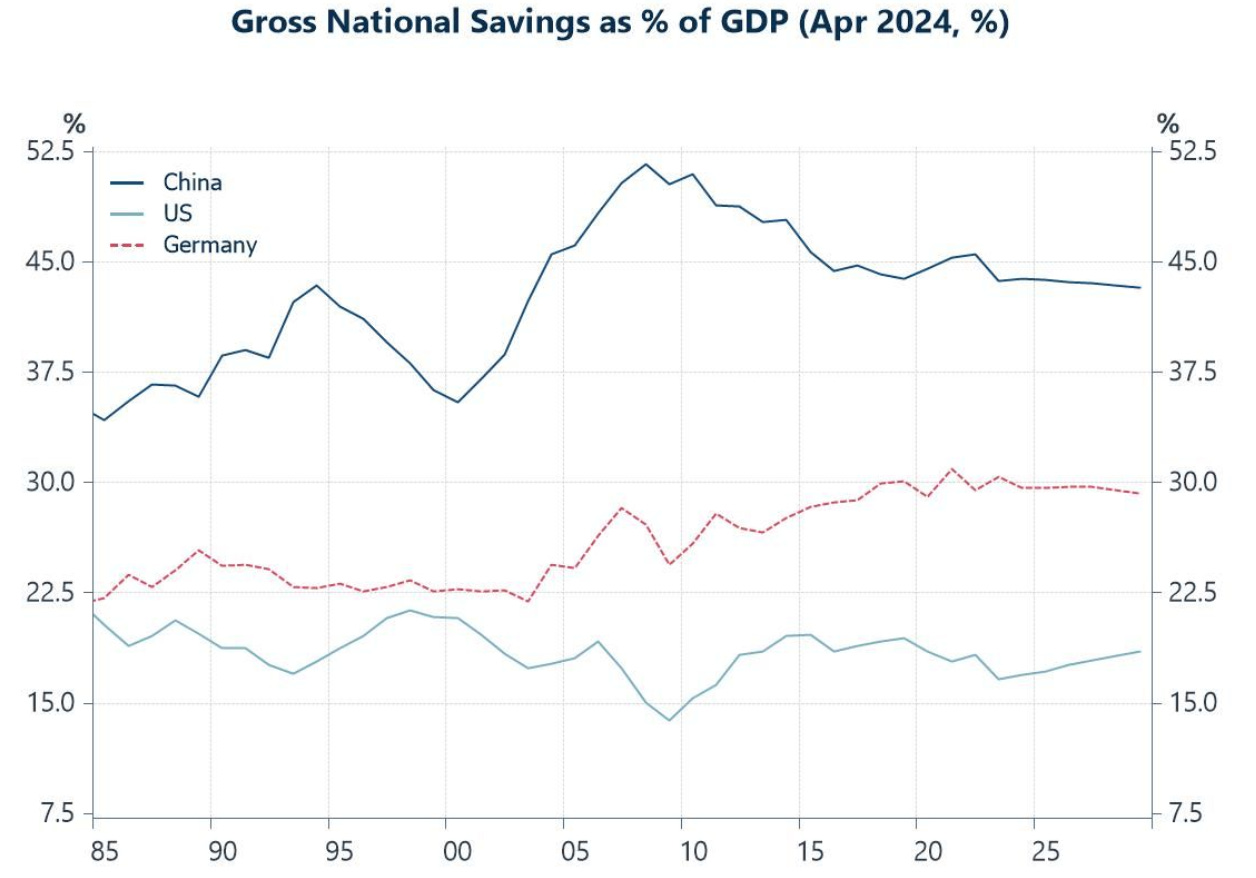
Global re-balancing
The trends in chart 3 below highlight one of the fundamental tensions in the global economy: the persistent gap in savings rates between China, Germany, and the United States, which is one reason (alongside relative investment proclivities) for trade and capital flow imbalances. China’s exceptionally high savings rate—consistently above 40% of GDP—reflects its export-driven growth model, where low domestic consumption rates and state-led investment create large external surpluses. Similarly, Germany’s high savings rate, hovering around 30% of GDP, stems from policies that have arguably compressed domestic wages and reinforced a structural reliance on exports. In contrast, the US has maintained a much lower savings rate, historically around 15-20%, reflecting its dependence on domestic consumption and foreign capital inflows to sustain investment. This imbalance has long made the U.S. the "consumer of last resort," absorbing excess savings from surplus economies, a dynamic that President Trump has repeatedly attacked as unfair.

Ageing and services
Tariffs alone may not achieve the US administration’s goals, as they fail to address deeper structural drivers of global trade imbalances. While tariffs make imports more expensive, they do little to alter economic specialisation shaped by demographics and domestic structures. The US has a disproportionately large service sector due to its consumption-driven economy, high healthcare spending, and dominant financial services, while China’s remains underdeveloped despite an ageing population, reflecting its investment-heavy model and weaker safety nets (chart 4). This divergence fuels trade imbalances, with the US absorbing demand from surplus economies like China, which prioritises manufacturing over services. Efforts to rebalance trade through reshoring face resistance from these entrenched models—China’s shift toward a consumption-led economy will take decades, while the US remains dependent on foreign capital. Until these imbalances adjust, trade tensions will persist, with policy struggling to override structural economic forces.

Wage inflation in the US and Europe
According to the latest trackers from the Indeed hiring company wage growth is slowing across major economies, but differences between the US, UK, and Eurozone highlight lingering challenges for central banks and particularly the Bank of England. US wage growth, which peaked at nearly 9% in 2022 amid labour shortages and policy stimulus, has fallen to just around 3%. The Eurozone has followed a similar trend. In contrast, UK wage growth remains close to 6%, thanks to worker shortages, cost-of-living adjustments, and possibly some Brexit frictions, which are posing a greater inflation risk (chart 5).

China’s property market
China’s property market is showing early signs of stabilization, with the Real Estate Climate Index beginning to recover and the pace of house price declines slowing. The price index for existing residential buildings across 70 cities, which had been in steady decline since 2021, is now deflating at a much slower rate, suggesting that policy support is gaining traction. The Real Estate Climate Index has also begun to edge higher, indicating a tentative improvement in market sentiment (chart 6). This turnaround follows a series of government interventions, including interest rate cuts, relaxed mortgage rules, and targeted support for developers. While challenges remain, particularly in restoring broader homebuyer confidence and sustaining demand, the latest data suggest that the worst of the downturn could be over. Whether this recovery can gain momentum will depend on the effectiveness of continued policy easing and whether China’s broader economic environment supports a sustained rebound in real estate investment.

