We get January inflation data on Thursday - it's expected to show a 7.3% increase in prices compared to a year ago.
That will be another 40-year high.
It's important to note, this historical comparison is referencing the right side of this early 80s portion of the inflation chart - AFTER Paul Volcker rolled out an inflation crushing 20% Fed Funds rate.
So the question is: Given the Fed hasn't even started raising rates, and at the moment has the Fed Funds rate set at 700 basis points UNDER the rate of inflation, are we on the left side of this early 80s spike?
It’s not just high gas/petrol prices that are feeding into the inflation rate. We will likely find that the Fed's core inflation rate (excluding gas and food prices) also hit a 40-year high in January (expected to be 5.9%).
The supply chain, which you would think will be softening prices, right?
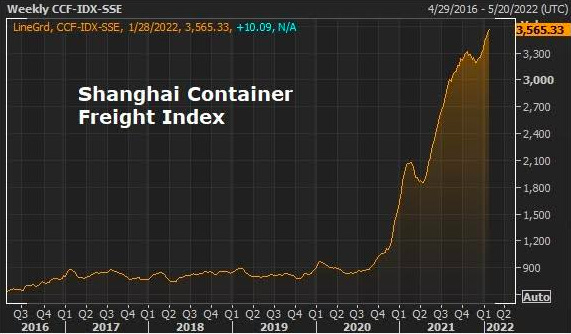
Let's revisit this chart of shipping prices that we’ve looked at several times over the past year.
No sign of slowing in shipping prices.
What about producer prices in China, where the products are made that we will be buying in the many months ahead?
You can see in the next chart, the rate-of-change in producer prices in China has rolled over. That looks like good news, but the year-over-year change still hovers around the highest in 26 years.
What feeds into these producer prices in China? Commodities prices After a small dip in broad commodity prices, following the Omicron news in late November, the CRB Index that tracks broad commodities has returned to aggressively trending higher.
With that, when we hear from China next week on producer prices, the rate-of-change will likely be ramping higher, again.
Bottom line, we should expect the inflation picture to continue to be burdensome, until global central banks finally kick into a hyper-aggressive mode (which doesn't look like anytime soon).


