


Buy-the-Dip?


US stocks plunged on Friday as economic data raised concerns about a slowing US economy and persistent inflation.
The S&P 500 lost 1.7%, and the Nasdaq 100 slipped 2.1%, while the Dow Jones plunged 748 points, marking its biggest loss of the year.
Consumer sentiment also took a hit, with the University of Michigan’s index falling to 64.7, reflecting growing concerns over inflation, which consumers now expect to rise to 4.3% in the coming year.
The slide followed Walmart's (-2.5%) disappointing outlook and broader fears about the impact of President Trump's tariff policies.
On the week, the S&P 500 dropped by 1.6%, while the Dow and Nasdaq slipped 2.5% and 2.4%, respectively.


Consumer sentiment is at its lowest point since July and September, respectively.
Both measures posted a local high after the election. Consumers’ assessment of the labour market fell for the first time in four months, and business conditions fell for the second consecutive month. Consumption tends to track changes in consumer confidence.
Although consumer sentiment is waning, the S&P 500 has been resilient, and investors continue to buy-the-dips. The stock market has experienced below normal levels of volatility (10-day realised volatility is 8.8%, the lowest 10-day stretch of the year) and broke out to new highs in the last week before Friday’s retracement.

It has taken roughly two months for the S&P 500 and NASDAQ 100 to breakthrough resistance. Technical traders may view this as a significant event as the market often continues to move higher following a retest of the breakout.
If the stock market is able to hold onto its gains over the next week, the breakout will be “confirmed.” Historically, tax season has not been a bullish time period for the markets as investors may be sending money to the IRS rather than to new equity purchases.
Over the next week or so, we will see if buy-the-dip remains the predominant investment thesis.

Market Outlook | A Technical Viewpoint
The below will be a weekly (Monday) addition to The Gryning Times. Daily updates to the tables are reserved for members of Investing by Design.

Nasdaq and S&P briefly hit new all-time highs before a dramatic reversal on Thursday and Friday which could be pointing to a failed breakout and double-top. We would need to see a break-down on the weekly charts to confirm the accumulation of risk-off readings.
Risk On
On the weekly charts, the key indexes remain in bull phases with positive momentum. (+)
Foreign equities continued to outperform the U.S. since late January and extended their gains and are both sitting in strong accumulation phases. (+)
Neutral
China was up over 6% on the week, going counter to the U.S. market and a dramatic outperformance. (=)
The color charts (moving average of stocks above key moving averages) are giving neutral-to-negative readings with the exception of the Nasdaq remaining mostly positive. (=)
Soft commodities pulled back this week, but is still leading the S&P. (=)
Gold made new all-time highs on the week, closing near them on Friday, outperforming the broader market by a wide-margin. The relationship between Gold and U.S. equity markets are at a potential inflection point. (=)
Risk-Off
All the key indexes were down sharply on the week (between -1.5% to -3.5%) with the Russels now down on the year -1.25%. The Dow lost its bull phase, IWM is in a distribution phase and closed under the 200-Day Moving Average. While both the Nasdaq and S&P are hanging on to bull phases but with momentum waning across the board on the daily charts. (-)
All of the key indexes have more distribution than accumulation days with the exception of the Nasdaq which is evenly split between them. (-)
Ten of the fourteen sectors we track were down on the week, led by retail and transports which could be pointing to a slowing economy. Consumer staples and utilities were both positive on the week, a classic flight to safety reading. (-)
The McClellan Oscilator flipped negative with the sell-off. (-)
The new high new low ratio rolled over this week due to weakness in the market on Thursday and Friday. (-)
The risk gauge went full risk-off. (-)
Unsurprisingly, volatility had a big jump closing in a bull phase for the cash index. (-)
Value began outperforming growth and the growth index moved into a warning phase. (-)
Semiconductors held onto their bull phase while regional banks and retail got crushed and, along with transportation, all closed in weakened phases. (-)
Rates eased this week across the yield curve, classic behavior in a risk-off environment. (-)
ETF Summary
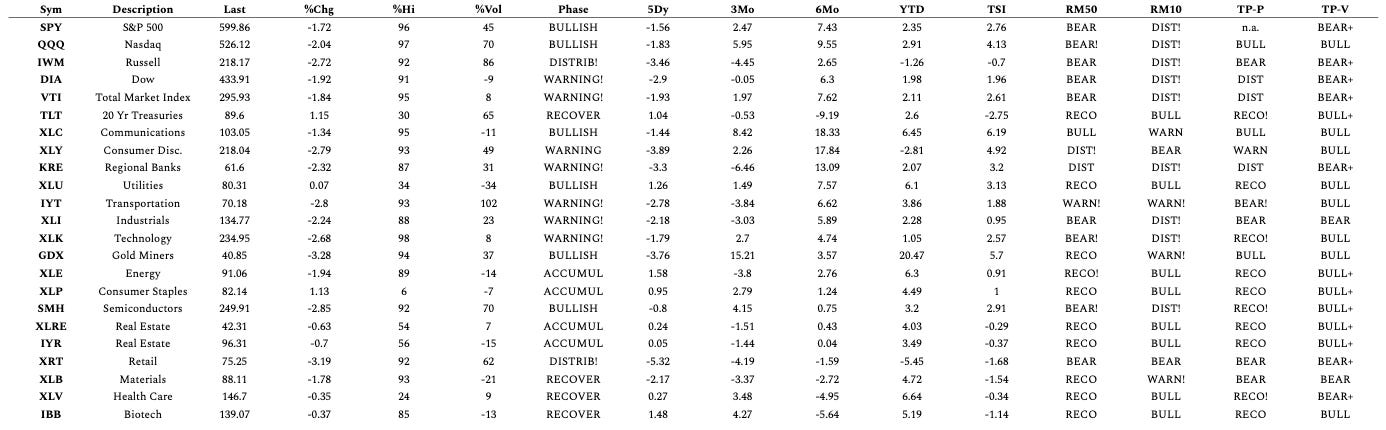
Market Hotspots | A source of new trades ideas when today's action creates an opportunity in the context of the Phase, 3-month, or 6-month trend!

Key | Market Phases
Bullish Phase: When the 50 DMA is over the 200 DMA, and the price is over the 50 DMA.
Warning Phase: When the 50 DMA is over the 200 DMA, and the price is under the 50 DMA, and over the 200 DMA.
Distribution Phase: When the 50 DMA is over the 200 DMA, and the price is under the 200 DMA.
Bearish Phase: When the 50 DMA is under the 200 DMA and the price is under the 50 DMA. This is the reverse of a Bullish Phase.
Recovery Phase: When the 200 DMA is over the 50 DMA, and the price is over the 50 DMA and under the 200 DMA.
Accumulation Phase: When the 200 DMA is over the 50 DMA, and the price is above the 200 DMA and 50 DMA.
Markets are as unpredictable as ever—shenanigans, surprises, and policy moves that could shake your portfolio. Investing by Design cuts through the noise, breaking down the impact on markets and what investors need to watch.