Directed by GRYNING quantitative analysis, GRYNING | AI is a stock recommendation & analysis tool designed to help you build market-beating portfolio’s.
Launching 03 June 2024 - Three Portfolio’s for Capital Appreciation
An investment strategy comprising of three data-driven market beating portfolio’s, using the Gryning AI Score to demonstrate the predictive power of our models.
U.S. Listed Single Stock Portfolio
European Listed Single Stock Portfolio
U.S. Listed ETF Portfolio
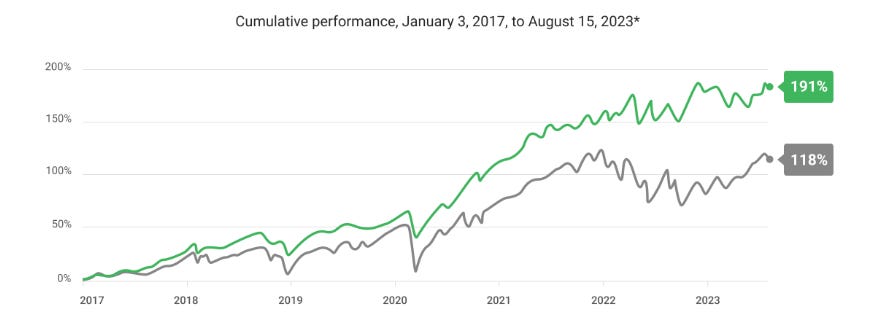
Our models conduct in-depth quantitative, data-driven research and analysis to ensure our stock picks are poised for long-term success. The performance to date (green line) has soundly beaten the market.
What is the AI Portfolio?
Three data-driven portfolio’s, each consisting off:
10 tickers, equally weighted, ranked as Strong Buys (AI Score 10).
Re-balanced every 3 months.
Portfolio constituents are removed (position closed) when individual ticker’s AI Score drops to 7 or below.
The highest ranked ticker in the universe and not in the portfolio is added, ensuring a constant allocation to 10 entities.
Who is this for?
Designed for investors looking for capital appreciation.
Does not require frequent trading - the portfolio’s are rebalanced every 3 months.
The portfolio’s are not designed to generate dividend income.
The portfolio’s cover multiple sectors and asset classes - this is because the best opportunities rotate and adapt to the ever changing market.
What should you expect?
Our goal is for the AI scores overall portfolio performance to significantly outperform the market. (So far, it’s done just that.)
We expect some of the picks to massively outperform the market, and some to underperform. Winners dominate the performance of the portfolio as they become larger positions.
Performance should be evaluated on the entire portfolio, rather than single picks.
Don't be surprised if picks are clustered in a single sector like tech or energy for a while. It could just mean that this sector is experiencing the greatest improvement.
Want a little more control?
Through our research, we look at how stocks & etf’s move by analysing the technical, fundamental, sentiment and quantitative model variables that drive asset prices. The goal is to help you exploit trading opportunities inherent in the market place. Our research empowers you to take more intelligent risks and understand where to spot opportunities.
Daily Broad Market AI Score summary table ( sample ).
Daily U.S. & European Single Stock summary table (EU sample) (US sample).
Weekly Alpha & Quant Model Analysis for Top & Bottom 10 U.S. & European listed single stocks (40 tickers/symbols in total) ( Alpha & Quant Model Analysis sample ).
Daily Trade Idea’s where Gryning AI has been most accurate since 2017, boasting at least a 60% win rate for Buy signals (long) and a 70% loss rate for Sell signals (short) over 1, 3, or 6-month time frames (sample trade idea's).


