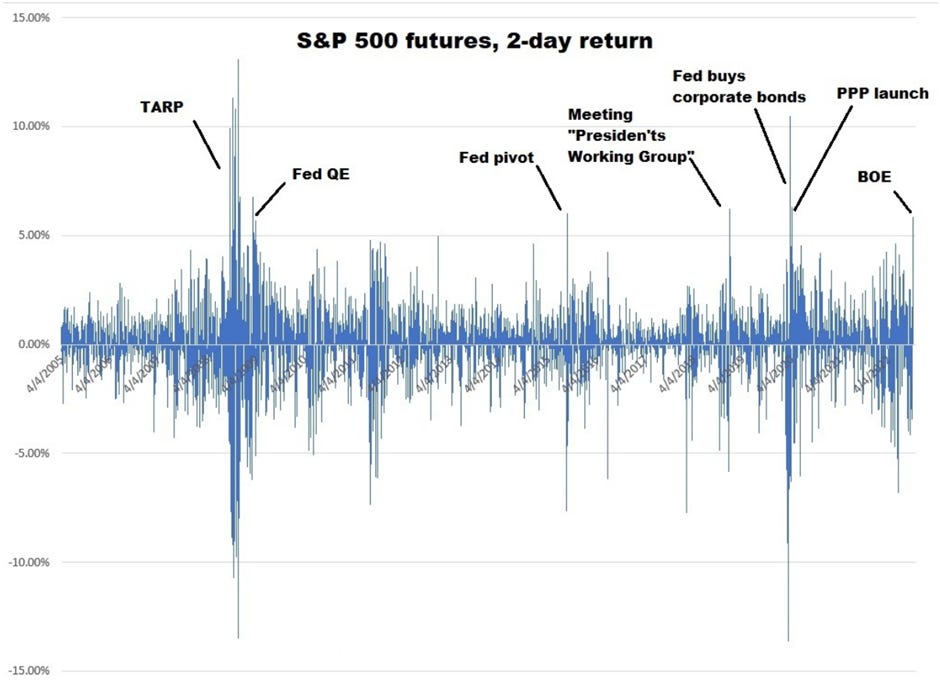
Yesterday, we discussed the big two-day move in stocks, and I presented Chart 1 below:
As you can see in chart 1, a two-day return of over 5% is rare, and every time since 2006, it has been fueled by policymaker intervention, to respond to a significant risk to, or destabilization of, the global financial system.
Today, let's step through the history in this chart, and talk about the event, the response, and the outcome.
Most recently (the far right of the chart), the Bank of England stepped in last week to buy UK government bonds. That reversed the aggressive rise in UK market interest rates, which were beginning to reveal an impending shock to the UK financial system, which (if history is our guide) would become contagious globally.
What was revealed? Fourteen years of global QE and zero rates have left the global financial system unable to sustain higher interest rates and shrinking liquidity.
As rates were rising in the UK last week, UK pension funds were getting margin calls, meaning they were forced to sell UK government bonds. When they sold bonds, yields went higher, which forced more margin calls, which required them to sell more bonds (and a self-reinforcing global sovereign debt spiral was underway).
The pain point on policy tightening was revealed to global central bankers. The Bank of England responded by buying bonds and reversing the rising tide of interest rates. Markets calmed. Global stocks rallied.
This move in stocks was the biggest two-day move since 2020. Additional spikes, driven by both fiscal and monetary policy interventions:
The early April spike on the chart came with the rollout of the Payroll Protection Program (backstopping businesses and jobs).
The big spike in March 2020 came as the Fed finally resolved a crisis in the bond market (a threat to the entire financial system) by vowing to outright buy corporate bonds and bond ETFs.
That was the COVID-lockdown driven bottom for stocks-the stock market went on to double over the next 18 months following that intervention.
Continuing to move left on the chart 1:
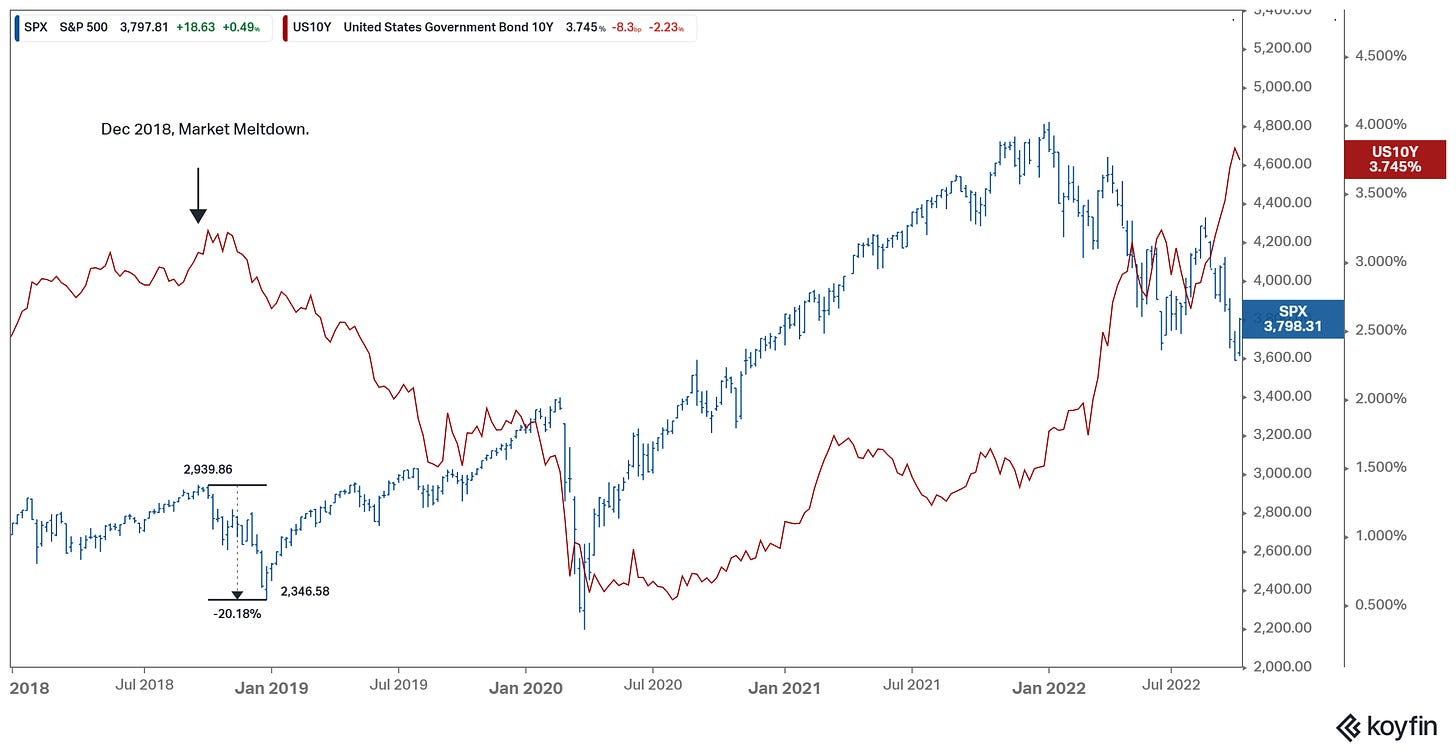
In December 2018, by Christmas, the stock market was on pace to have the worst decline since the Great Depression. The Fed had hiked rates three times that year, into a slow economy, having systematically hiked seven times since the 2016 election. It was when the 10-year yield surged through 3% that stocks began a calamitous fall (falling 18% over 23 calendar days). Here's a look at the chart on yields (notice where we are now, in relation)...
Stocks were signaling fear in the markets that the Fed had already gone too far (i.e., was choking off economic momentum). The Fed ignored the signals and mechanically raised rates again at their December meeting.
The bottom fell out of stocks. By December 26th, the S&P 500 was down 18% for the month of December. That led to a response from the U.S. Treasury (i.e., intervention). Mnuchin (Treasury Secretary) called out to major banks and the President's Working Group on Financial Markets (which includes the Fed) to "coordinate efforts to assure normal market operations.”
That was the turning point—that put a bottom in stocks.
Within days of that, the three most powerful central bankers of the past ten years (Bernanke, Yellen, and Powell) were backtracking on the Fed's rate path-signaling a pause. Stocks rose 47% over the next 15 months.
Let's continue moving left on my S&P returns chart 1 above:
In 2015, once again, it was the Fed. By mid August, China's stock market had boomed and crashed, all in 2015. The Chinese economy was slowing, and in August they surprised the world with a currency devaluation.
Meanwhile, the Fed had ended QE a little less than a year earlier, and the Fed had well telegraphed its first post-Great Financial Crisis rate hike for the following month (September), but there was plenty of global angst surrounding the removal of liquidity by the Fed.
In August, U.S. stocks crashed 13% in six days (including a 7% flash crash).
The Fed responded two days later (August 26). The New York Fed governor spoke at Jackson Hole and cited the market turbulence for making a September rate hike unlikely. From the lows that day, stocks bounced 9% in fifteen days, and ultimately 14% from those lows.
If we continue moving left on the S&P returns chart 1 above, we see the other rare 5%+ two-day moves in the S&P futures. They come (far left on the chart) around massive monetary and fiscal policy intervention to avert disaster from the Lehman failure and Global Financial Crisis.
It was the Fed launching QE, and G20 global central banks vowing to coordinate policy, that solidified the bottom for stocks (in March of 2009).
With all of the above in mind, as we've discussed this week, major turning points in markets have often been the result of some form of intervention (i.e., policy action or adjustment). We can see it in the examples above. And based on this history, it's fair to say that we are at a significant moment, seeing significant vulnerabilities in the financial system (driven by rising rates), and we've seen a significant response (by the Bank of England).
Will there be more intervention? Maybe. But we know that interest rate markets have reached the "uncle point," and that central banks are on high alert and will do whatever it takes to preserve financial stability. And these moments are, historically, turning points for markets.
PS: I have been writing The Gryning Times, every weekday, for over two years - outlining the major macro factors that drive asset prices and ultimately affect our portfolio’s/pensions. I would appreciate it if you could share my writing with anyone you think is interested or is likely to benefit from it.


