


A Bet


US stocks closed mixed Thursday as investors weighed earnings, economic data, and lingering trade uncertainty.
The S&P 500 rose 0.4% for a fourth straight gain, lifted by Cisco’s 3.7% jump on an upbeat AI-driven forecast, while the Dow added 271 points and the Nasdaq 100 finished muted, as Amazon and Meta weighed.
Retail giant Walmart fell 0.4% after warning it would raise prices due to tariffs, even as it reported better-than-expected sales.
GE gained 2.8% as Qatar pinned Boeing's largest wide-body aircraft order to be solely made with GE engines.
Economic data showed retail sales slowed in April and wholesale inflation unexpectedly fell, easing price concerns and pushing Treasury yields lower.


Due to travel, a change to the usual market commentary.
Betting markets point to a ~45% chance of recession in 2025. Option markets are inclined to disagree. This allows us to construct a very interesting combination bet.
Let’s start with the key assumption: if there is a recession, then it’s fair to say that SPX will be down from these lofty levels at some point during the year - agreed?
Now imagine these two bets combined:
There will be NO recession in 2025.
SPX will be down by year end.

By balancing the amount of capital on each bet, one can lose money ONLY if there IS a recession but SPX is actually UP. That seems counterintuitive.
There’s enough evidence of mis-pricing between the two different markets that a smart trader might be able to construct a very compelling risk-return out of them.
A message from the Sponsor: The GRYNING Times membership.
April 19, 2025, we posted a note on Post Crash Patterns - where we discussed a useful framework to help navigate market bottoms & tops: harmonic-oscillation patterns. This stylised pattern helps to describe how systems return to equilibrium, like the swing of a pendulum.
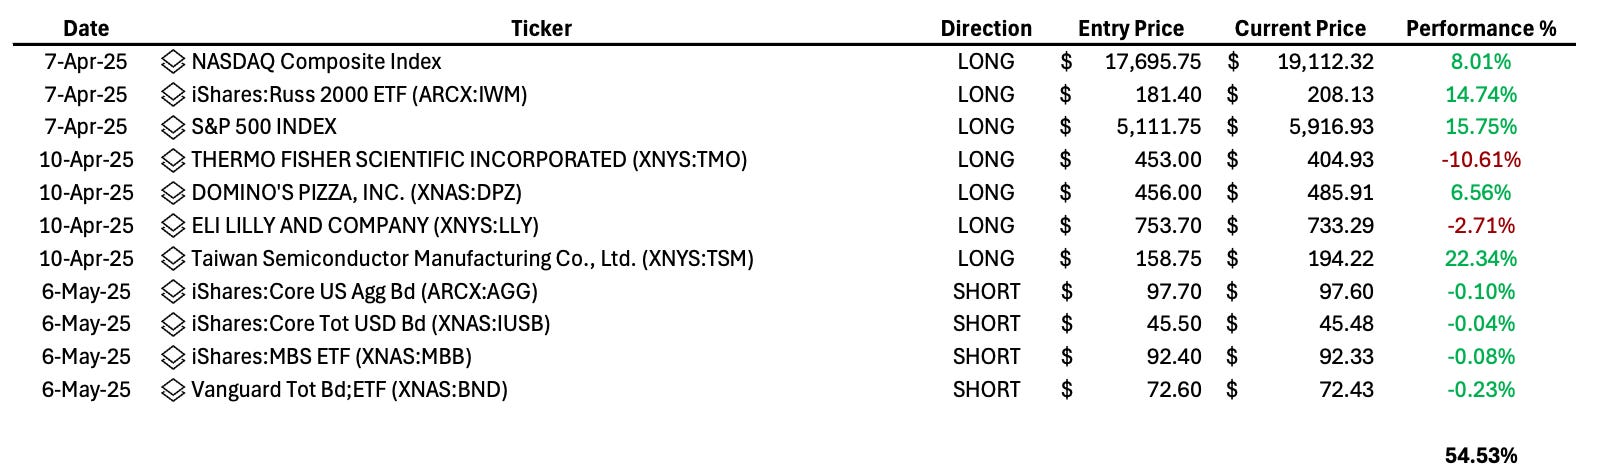
Within the post, we highlighted several “Trade Idea’s” which we had sent out to members earlier in the month (please see the post for charts);
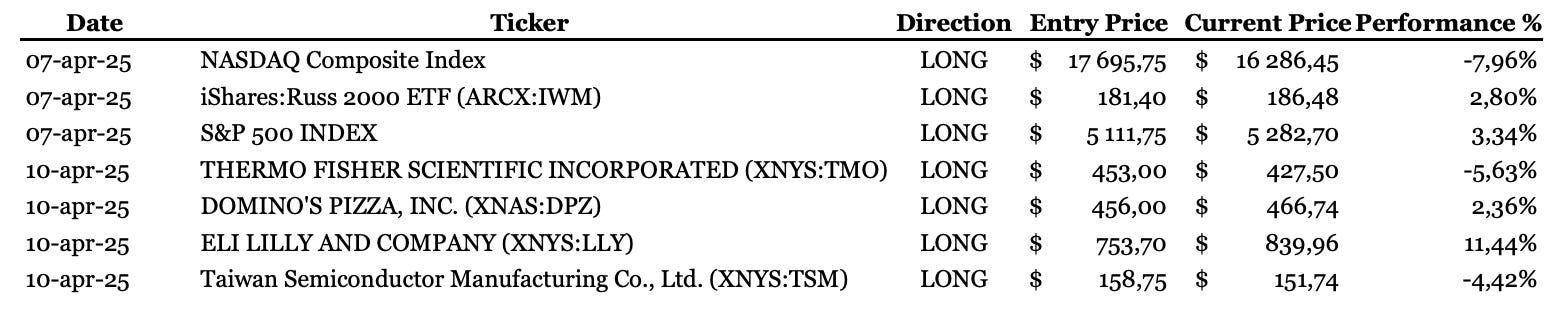
On May 06, 2026, we sent out further “Trade Idea’s” - Pressure Points where we anticipated significant changes in trend for the bond markets. We highlighted the charts here.

Today, our Trend Monitor model points towards daily top signals in a number of equity markets - indicating the high likelihood of sideways to down price action to last through the month of May. As such, for those following along, we recommend closing out the broad equity positions: Nasdaq for +8%, IWM for +14.5% and SPX for +15.5%.
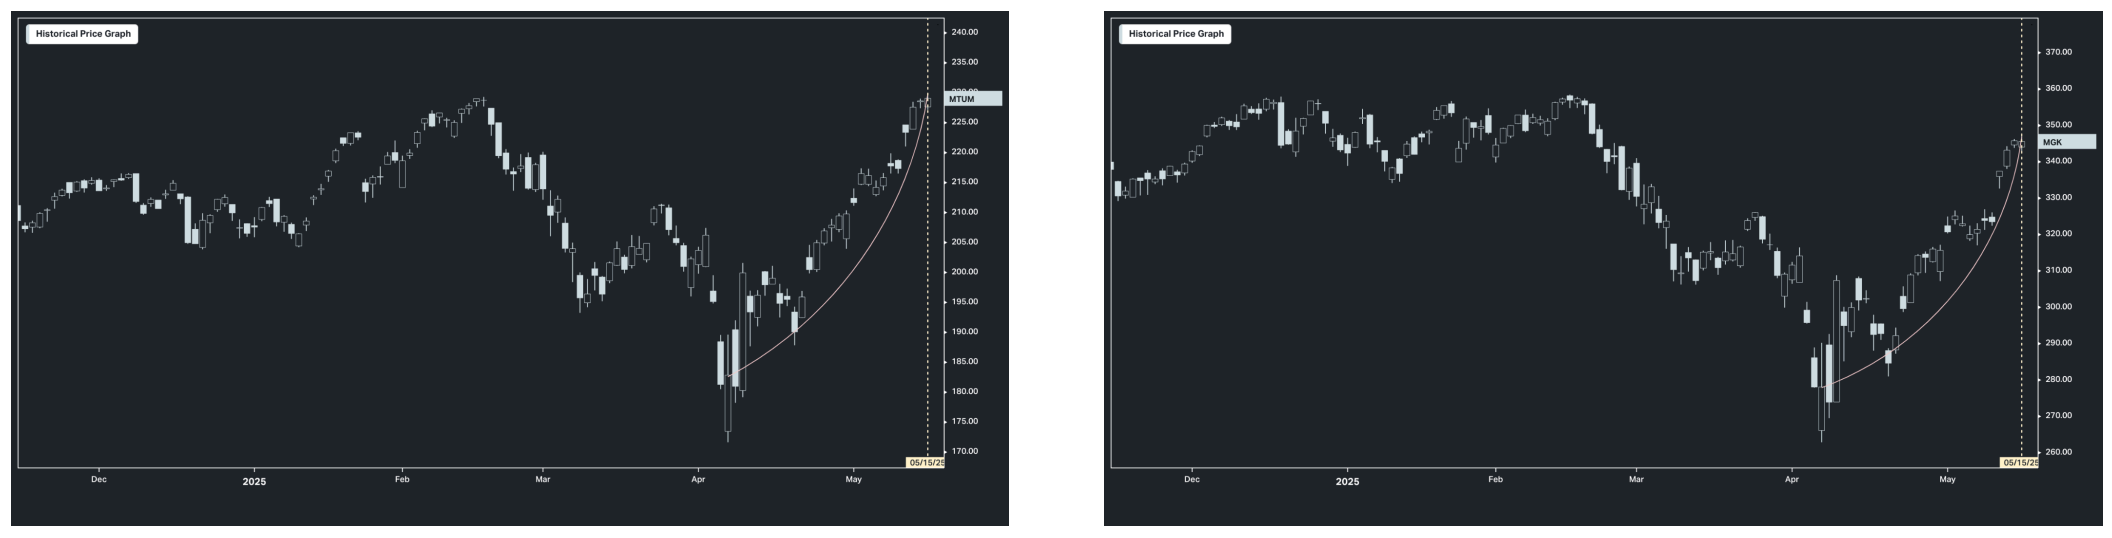
The 6 charts below represent a small sample of Top Signals flagged up by our trend model. If you are looking to either take risk off or deploy capital, expect sideways to downside price action in the following etf’s and structure your trades/positioning according to your internal risk metrics.
NDX | IVW | SOXX | XLK | MTUM | MGK

Membership to The GRYNING Times gives you;
Informative Content: Monthly Trend Report with daily updates alongside a weekly Commodities Chartbook.
Actionable Content: Trade Idea’s as identified by out Trend Model alongside weekly option spread strategies for both commodity & equity markets.