#4 $CDNS
Trade Idea of the Week
We highlight every week a stock with a high average win rate for its BUY signals (above 70% after 3 months since 2017), and which is currently rated as a BUY or Strong BUY by Gryning AI.
Current Hypothetical Portfolio
The portfolio is built with one stock a week, with a 3 month horizon per trade idea limiting the total number of positions to 12. Additionally, each trade idea will be expressed and tracked using 2 positions; an ATM Call or Put option alongside a Bull Call Spread or Bear Put Spread (using strike prices at the most expected path and price range high/low at 90% confidence level).
Cadence Design Systems [ CDNS 0.00%↑ ]
Fundamental 9 | Technical 9 | Sentiment 9 | Low Risk 6
AI Score 9 | Buy
CDNS - Suggested Trading Parameters
Entry Price: $309
Horizon: 3 months
Stop Loss: $283 (-8.41%)
Take Profit: $383 (+23.79%)
Today our AI maintains a BUY rating (AI Score 9/10) on Cadence (CDNS), because its overall probability of beating the market (S&P 500) in the next 3 months (39.75%) is +7.17% vs. the average probability (32.58%) of all US-listed stocks.
CDNS Buy Signals Track Record
Below, you can see the Cadence chart since October 2023, with the past Gryning BUY signals (AI Score 7 to 10) highlighted in green. In the 3-month forecast, the central dotted line shows the most expected price path (+10.52%). The shaded area is the expected price range (-11.39% to +32.48%) based on the previous BUY signals with a 90% confidence level:
3 months after each of its 1340 BUY signals (since Jan. 2017), CDNS achieved in the past a 75.33% win rate (positive performance cases) and a +10.55% average performance.
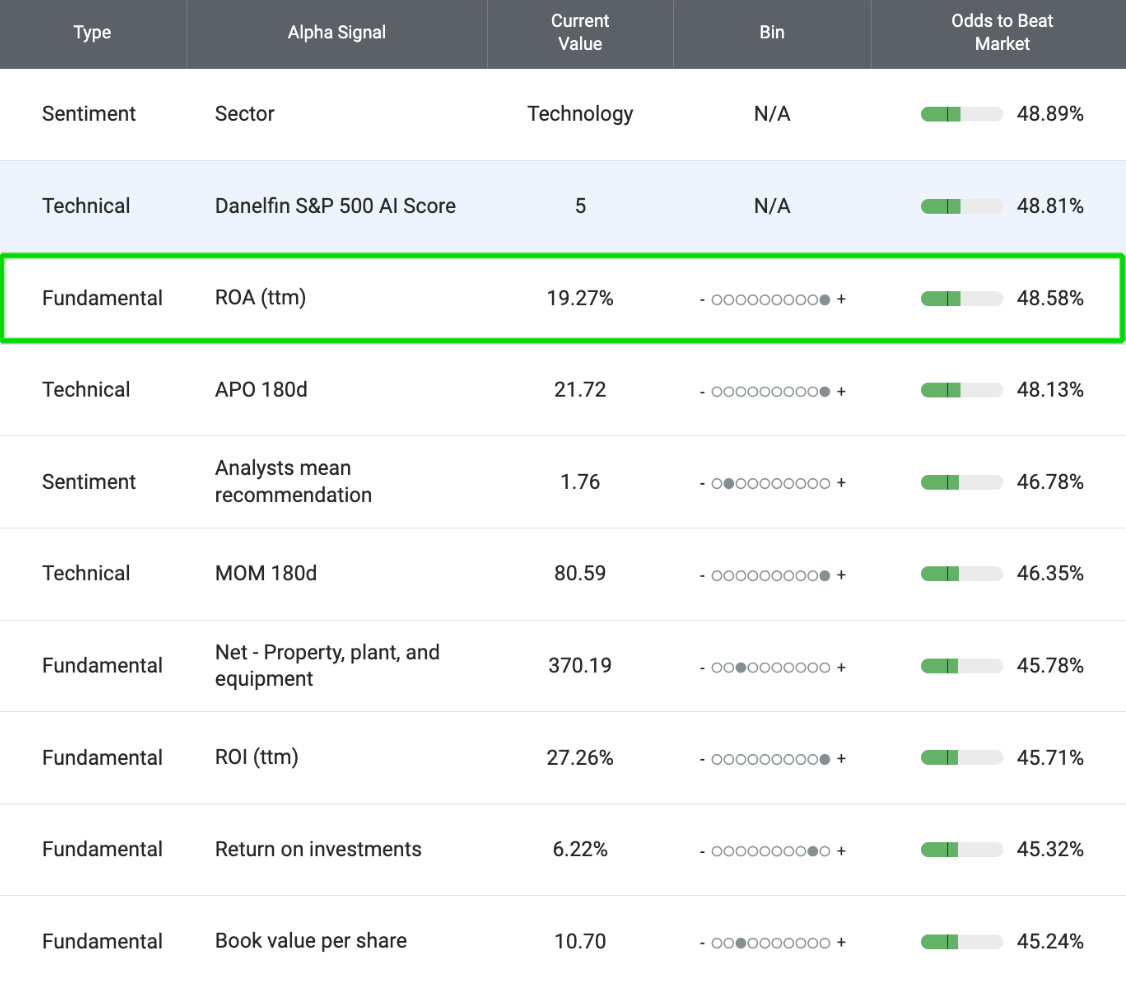
Today's Cadence BUY rating (AI Score 9/10) is based on the 21 fundamental, technical, and sentiment features that are among the ones that had the greatest impact on the performance of stocks during the last 12 months (alpha signals). Below you can see the top 10 alpha signals, ordered by relevance:
One of the top CDNS alpha signals today is its ROA (return on assets, trailing twelve months). It currently stands at 19.27%, ranking it among the highest (bin 10/10) of all US-listed stocks.
During the last 12 months, stocks with this feature (an alpha signal) outperformed the market in 48.58% of the cases after 3 months vs. the average (32.58%) of all US-listed stocks. This feature is in the 98th percentile, which means that 98% of the alpha signals analysed by Gryning have an equal or lower probability of generating market outperformance (alpha).
Gryning is a stock analytics platform powered by Artificial Intelligence. It helps investors to pick stocks, optimise their portfolios, and make smart data-driven investment decisions.
Past performance is no guarantee of future results. The future performance of any specific investment or strategy may not be profitable. Any stocks' performance examples provided are for informational purposes only and do not imply that other stocks had or will have a similar performance. No recommendation or advice is being given as to whether any investment is suitable for a particular investor.


